Tableau Developer Resume Format, with 3 Full Samples
A Tableau developer is hired on evidence of decisions a dashboard drove and a slow workbook made fast, yet most resumes list Tableau, calculated fields and dashboards and stop there. Below are three complete resumes, one for a fresher moving in from analytics, one for a developer with four years building governed dashboards on real data sources, and one for a senior developer owning the Tableau Server estate and its performance. After the samples come the format rules, why a data source beats a dashboard count, the terms a parser matches literally, and the mistakes that end a screening before a human opens the file.
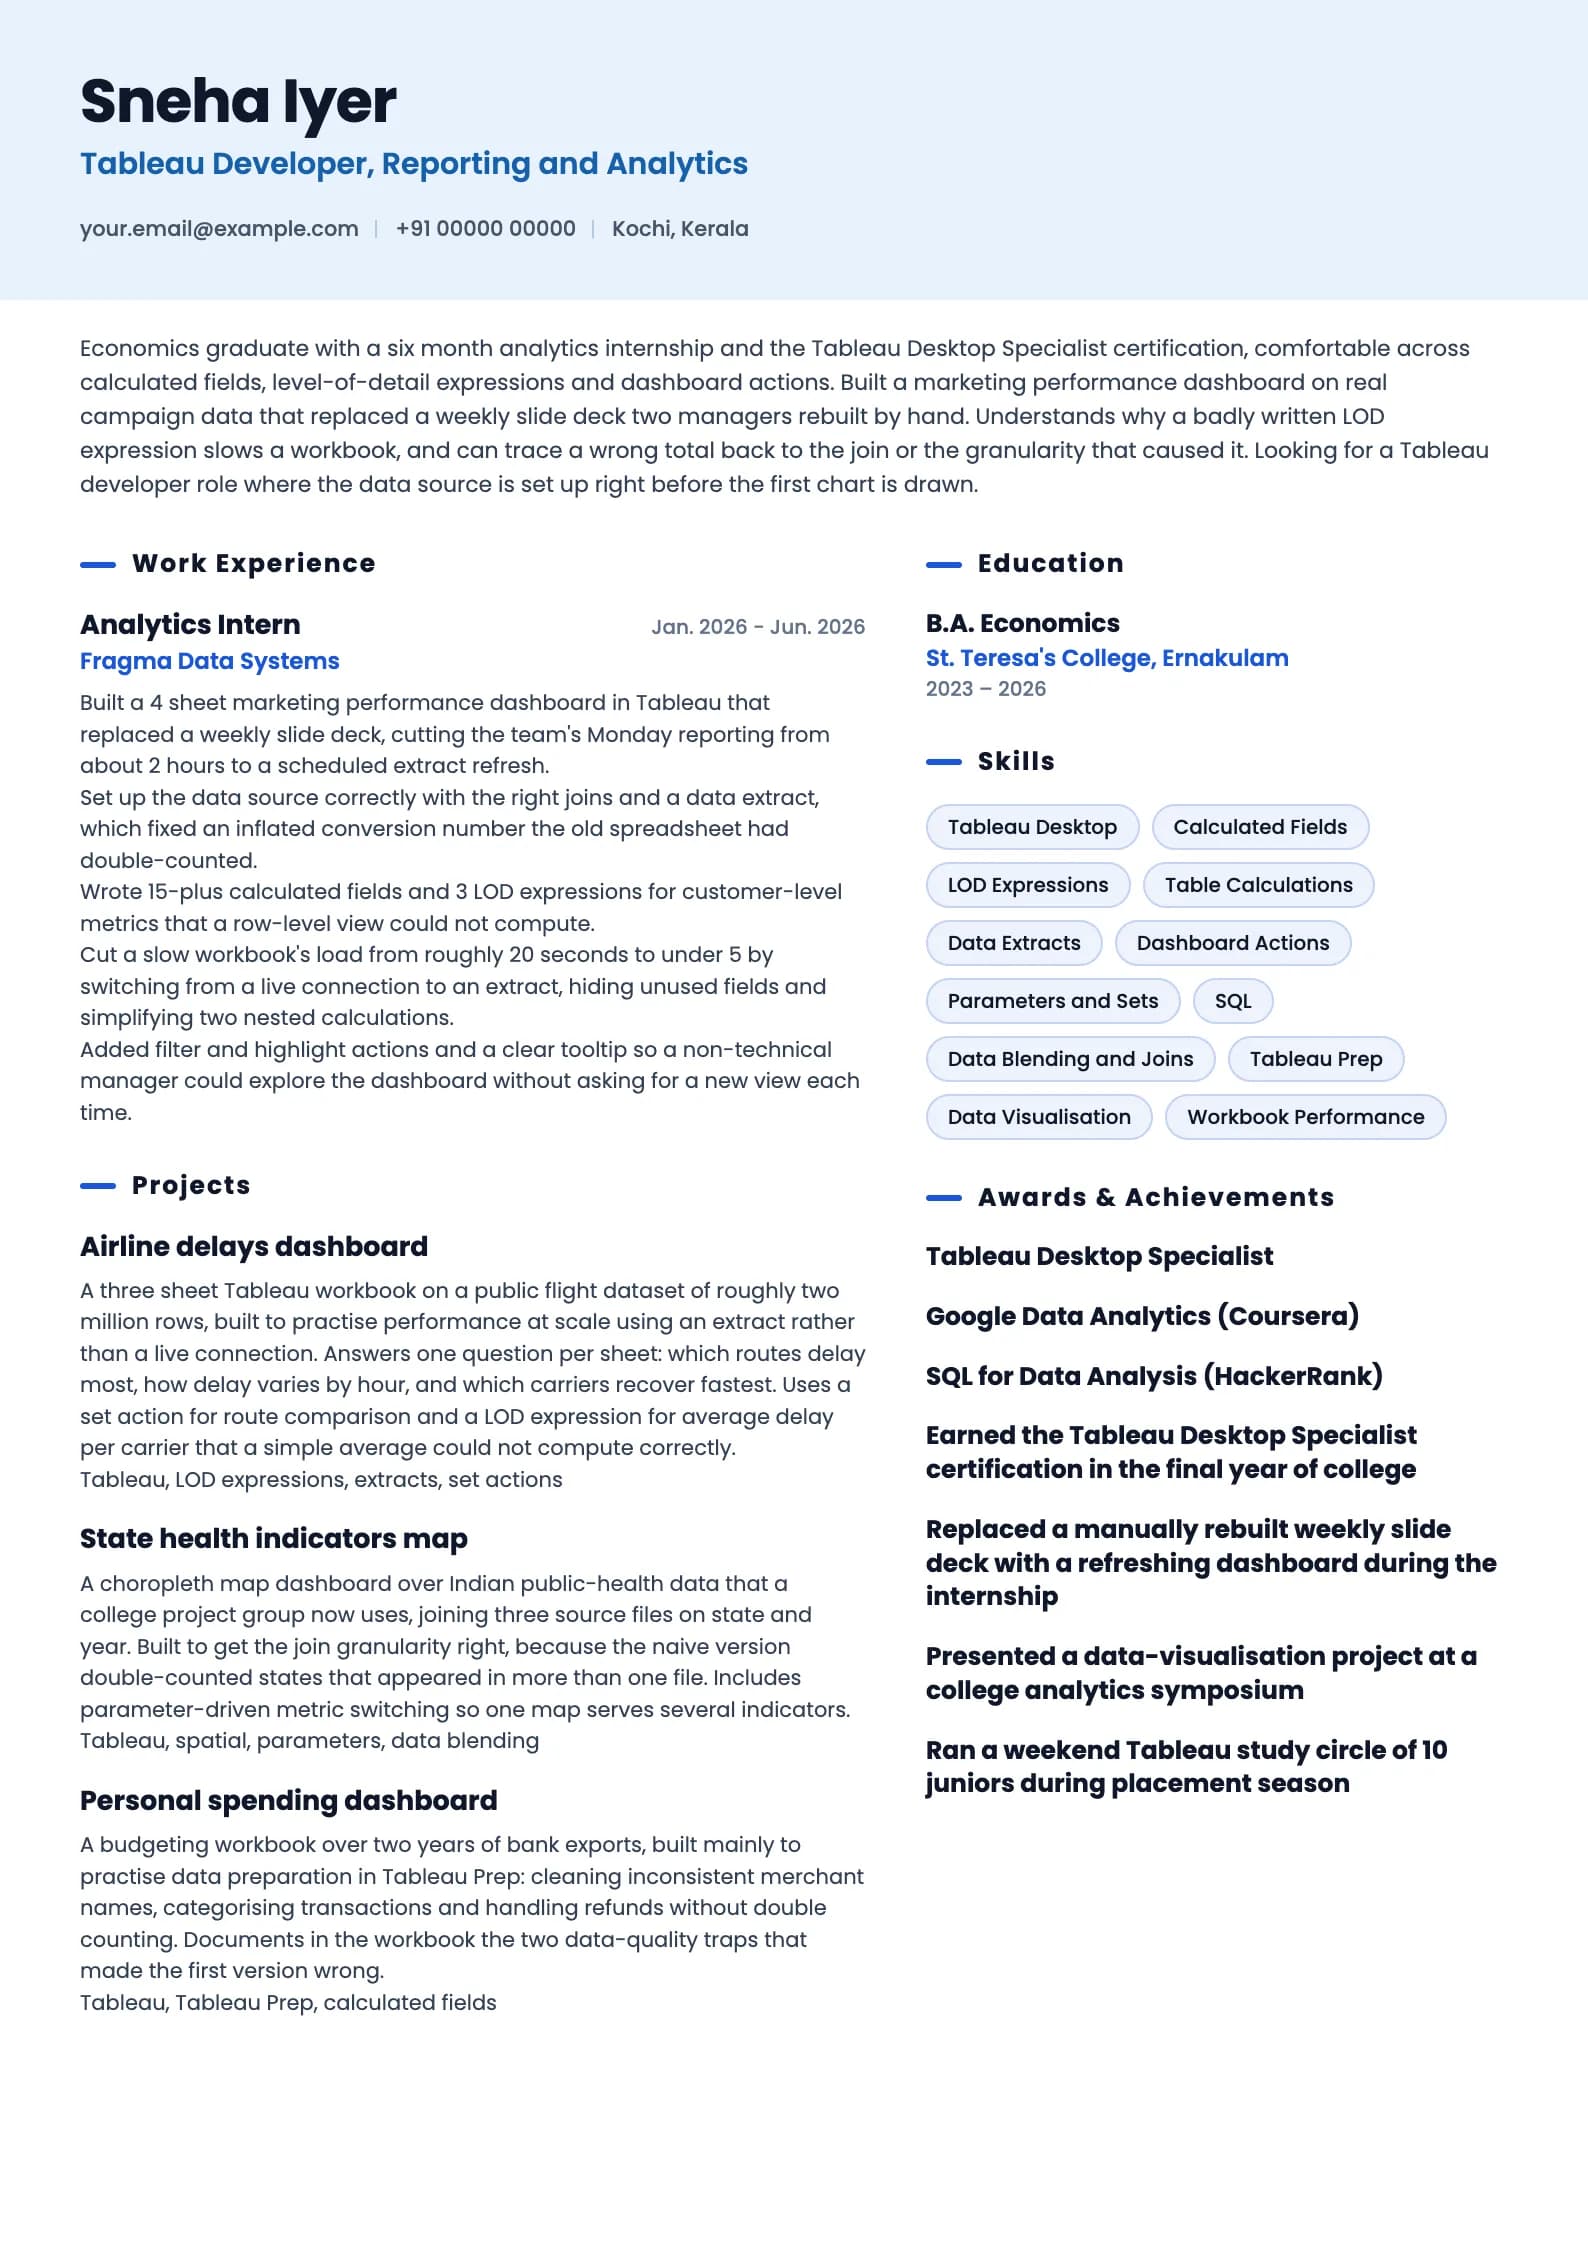
Build my resumeTableau Developer resume example, Fresher (0 to 1 years)
ai-era templateIs your resume good enough?
Upload the resume you have now and see what an applicant tracking system reads before a tableau developer recruiter ever does.
Free to run. Sign in with your mobile number to see your score.
Tableau Developer resume example, Mid-level (4 years)
modern template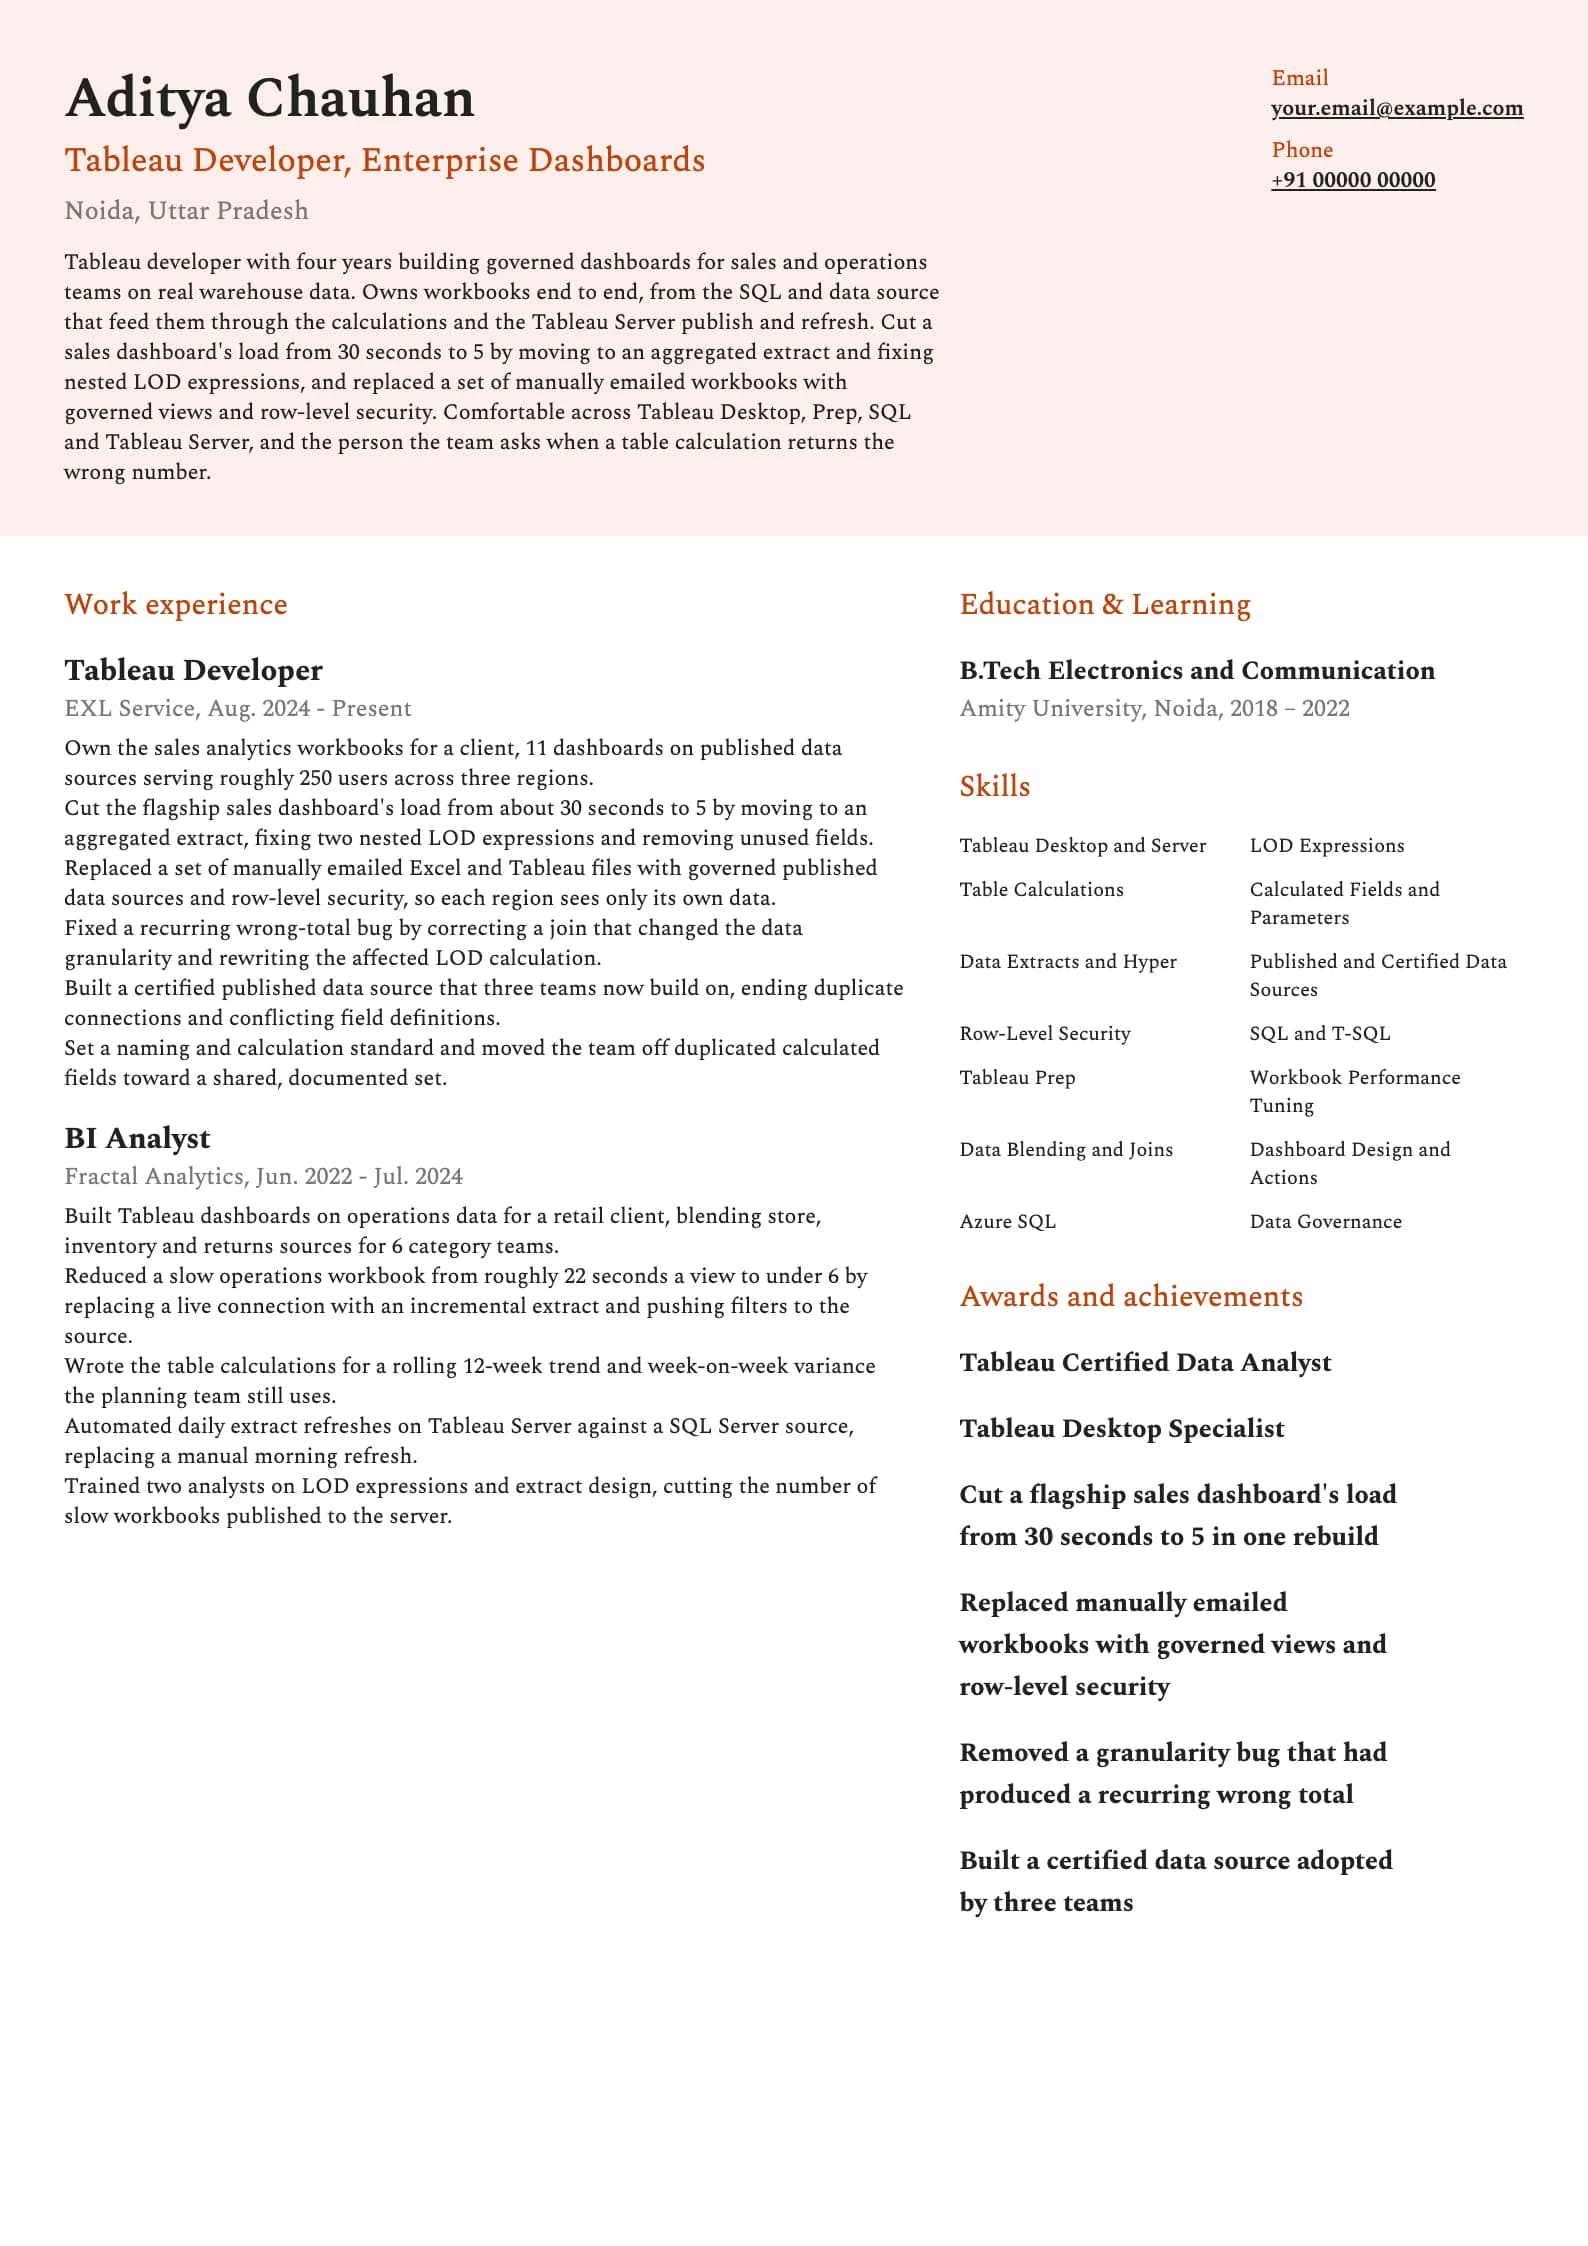
Want this structure with your own details? Build it in the resume builder.
Tableau Developer resume example, Senior (9 years)
header-band template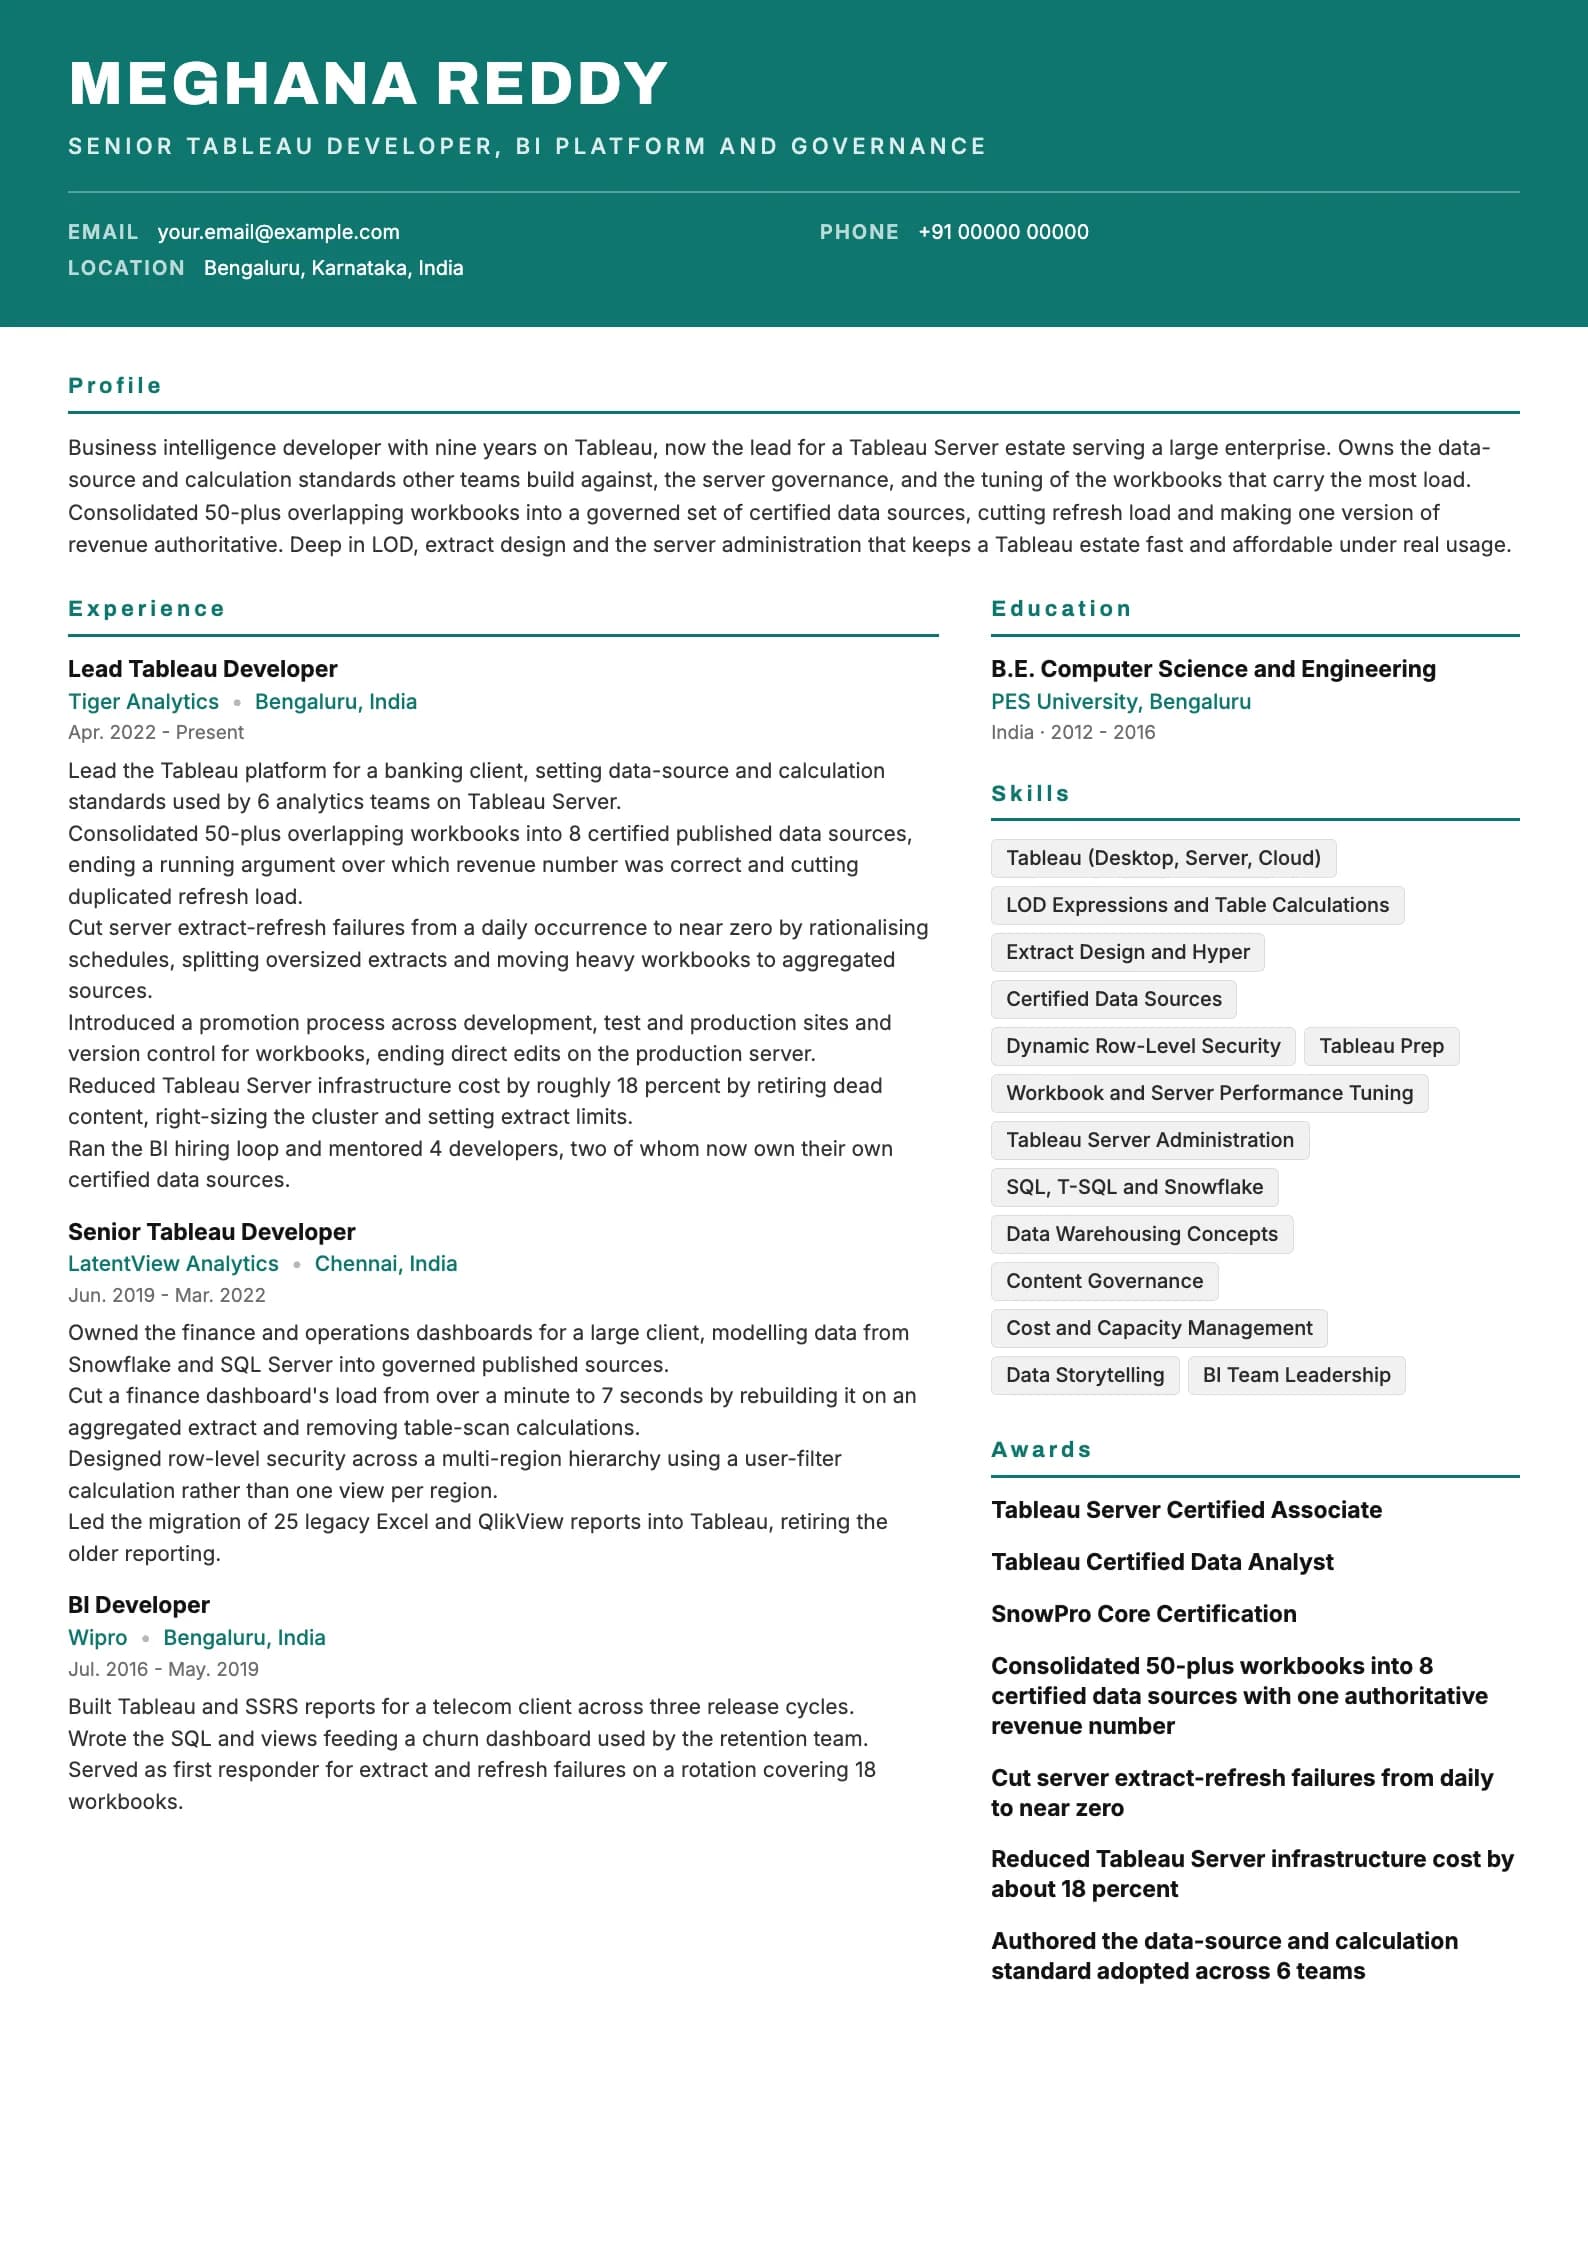
The format that works for Tableau developer resumes in India
Reverse chronological is the only layout worth using. Put the most recent role first, work backwards, and keep the dates in plain view. Functional resumes that group everything under a Tools heading and quietly drop the dates read as an attempt to hide a gap, and reviewers treat them that way. Length is decided by evidence. One page holds everything a fresher and most developers up to roughly six years have to say. Past that a second page is fine when it carries real data-source and server work rather than a longer list of chart types. A page two built from a declaration paragraph and a hobbies line is a padded one-page resume. Four things belong nowhere on a technical BI resume here: a photograph, date of birth, marital status and father's name. They survive from an older template that circulated through campus placement cells. Nobody screening a Tableau developer is looking for them, and every line they occupy is a line a project or a result could have used. Send a PDF unless the posting asks for DOCX, and name the file with your own name and the target role rather than resume_final_v4. Use a single column all the way down, because two-column layouts parse unpredictably when a sidebar sits beside the experience. The table below sets out the section order.
| Section | Where it goes | Why |
|---|---|---|
| Name and headline | Top, above everything | The headline is the role you want, Tableau or BI developer. Recruiters match on it. |
| Professional summary | Directly under the header | Three lines. Stack, years, and the single strongest result. |
| Work experience | Next, for anyone with a job | Most recent first. Newest role gets the most bullets. |
| Projects | Above experience for freshers, below it after that | For a fresher this is the evidence. For an experienced developer it is supporting material. |
| Skills | Below experience | Grouped: calculations, data sources, server, tools. Not a 40-item wall. |
| Education | Bottom, unless you are a fresher | Degree, institution, years. Drop the percentage after your first job. |
| Certifications | After education, or beside skills if only one or two | Name, issuing body, year. Desktop Specialist and Data Analyst earn their place. |
A data source beats a dashboard count
The single most common Tableau resume failure is a summary that leads with "built 40-plus interactive dashboards". A dashboard count says nothing about whether the numbers on them were correct or whether the workbook opened before the user gave up, which are the two things a hiring manager actually worries about. Anyone can drop fields onto a canvas. The value is in the data source and the calculations underneath. Lead with the data source. The right joins, correct granularity, an extract sized for the query pattern, a certified published data source other teams can trust: these separate a Tableau developer from someone who has watched a Tableau tutorial. The mid-level sample says "built a certified published data source that three teams now build on" and "corrected a join that changed the data granularity" precisely because those lines prove data judgement, not tool familiarity. Be specific about calculations. Writing calculated fields on the skills line means nothing on its own. A bullet that says you fixed a nested LOD expression, or rewrote a table calculation that returned the wrong total, or used a set action to solve a comparison a filter could not, shows you understand the parts of Tableau that are genuinely hard and where beginners go wrong. Performance is a first-class result. A slow workbook is the most common complaint a Tableau team gets, so a bullet that names a load time you cut, and how, carries real weight. Extract versus live, aggregation, unused fields, nested calculations: name the technique, not just "optimised the dashboard".
For every skill on your line, ask: is there a bullet that proves I used it on a real data source. A wall of Tableau features with no data or performance evidence helps the parser and hurts the interview.
Writing a summary a hiring manager actually reads
The block under your name is the part you can be reasonably sure gets read, so it should carry three facts: what you build, how long you have been building it, and the strongest thing that happened because of your work. Three or four lines, no adjectives that cannot be checked. The old objective line, seeking a challenging position in a reputed organisation to utilise your Tableau skills, tells the reader nothing they did not assume from the application. Replace it with a summary. An objective describes what you want, a summary describes what you have already done, and only one is evidence. Freshers often believe they have nothing to summarise. Look at the fresher sample: it names the stack, states the internship length, and points at a dashboard that replaced a real manual deck and the data-source decision behind it. That is a genuine summary built from coursework, one internship and side projects. What it avoids is "passionate about data visualisation", a phrase so common on analytics resumes it now carries no information. A practical test: read your summary and ask whether a classmate with the same Desktop Specialist could paste it onto their resume unchanged. If they could, it describes the certification, not you. Add the specific dashboard, the specific load-time number and the specific ownership until it stops being transferable.
Professional summary, mid-level developer
Weak
Passionate Tableau developer with 4+ years of experience in dashboards, calculated fields and data visualisation seeking a challenging role in a reputed organisation to leverage BI skills.
Strong
Tableau developer with four years building governed dashboards for sales and operations teams on warehouse data, owning workbooks from SQL to server refresh. Cut a sales dashboard's load from 30 seconds to 5 and removed a granularity bug that produced a recurring wrong total.
The rewrite trades a keyword list and self-description for a domain, an ownership scope and two verifiable results.
Experience bullets: verb, workbook or data source, consequence
Every strong bullet in the samples follows the same shape. It opens with an action verb, names the specific workbook or data source you built, and closes with what measurably moved. The verb establishes that you did it. The workbook tells a technical reviewer whether the work is relevant. The number does the persuading. Start with the outcome and work backwards. Developers usually write the task first, then struggle to attach a number, which produces bullets like "created dashboards in Tableau for the sales team". Instead ask what was different after you shipped: a workbook got faster, a wrong total got fixed, a manual deck disappeared, a server cost dropped, teams stopped building conflicting connections. Then write the sentence that ends in that fact. Vary the metric. A row of load-time numbers reads as one trick repeated. Across a real role you can honestly reach for load time, extract refresh time, hours of manual work removed, workbooks or data sources consolidated, users served, server cost and data-quality bugs fixed. The mid-level sample uses several of these across its bullets, which reads as range. Where you lack a number, give scope: how many dashboards, how many source tables blended, how many regions under row-level security, how long a migration took. "Migrated 25 legacy Excel and QlikView reports into Tableau" carries weight without inventing a percentage. Allocate bullets by recency. Current role gets five or six, the previous role four or five, anything older two or three.
| Level | What bullets must prove | Typical metric |
|---|---|---|
| Fresher | You can build a correct data source, not just a chart | Load cut, manual hours removed, sources joined, project users |
| 1 to 3 years | You own a workbook without supervision | Load time, refresh time, workbooks built, calculations shipped |
| 4 to 6 years | You own the data source and workbook end to end | Load time, users served, decks replaced, bugs fixed |
| 7 years and up | You set data-source standards and govern the server | Workbooks consolidated, server cost, refresh failures, standards set |
Experience bullet, reporting role
Weak
Responsible for developing interactive dashboards and reports in Tableau as per business requirements.
Strong
Replaced a set of manually emailed Excel and Tableau files with governed published data sources and row-level security, so each region sees only its own data.
"Responsible for" describes a job description; the rewrite names what was replaced and the governance it introduced.
Experience bullet, performance work
Weak
Optimised Tableau dashboards which improved the performance and user experience significantly.
Strong
Cut the flagship sales dashboard's load from about 30 seconds to 5 by moving to an aggregated extract, fixing two nested LOD expressions and removing unused fields.
Names the before and after and the exact techniques, so a reviewer can ask a real follow-up instead of nodding at a vague claim.
If a bullet would read identically on a teammate's resume, it is describing the team, not you. Rewrite it until it only fits the workbook and data source you actually owned.
The skills section: grouped, honest, and short enough to defend
A Tableau resume's skills section has two audiences with opposite preferences. The parser wants literal terms it can match, Tableau and LOD expressions and table calculations. A human wants a short, organised list that signals what kind of developer you are. Grouping satisfies both. Group by function rather than one long line. Calculations, data preparation, server and governance, and data sources is a grouping that works for almost every Tableau developer. The exact headings matter less than the fact that structure exists. Write names the way Tableau writes them: LOD expressions not LODs, Tableau Prep not TabPrep, Hyper not hyper. A parser matches on strings. Twelve to sixteen skills is the working range. Below eight the section looks thin. Above twenty it stops being a signal. A Tableau resume is prone to a specific padding pattern: listing every chart type and shelf as a skill. Bar charts, line charts, maps, treemaps and the colour shelf are not ten separate skills, they are how the tool works. List the things that take judgement: LOD expressions, extract design, data source setup, performance tuning, row-level security. Do not include a proficiency bar. Star ratings invite an argument you cannot win, and nobody agrees on what four stars in LOD expressions means. Let the experience prove the depth instead.
| Group | What goes in it | How many |
|---|---|---|
| Calculations | LOD expressions, table calculations, calculated fields, parameters | 3 to 4 |
| Data prep | Data sources, joins, blending, extracts, Tableau Prep, SQL | 3 to 5 |
| Server and governance | Tableau Server, Cloud, certified data sources, row-level security | 2 to 4 |
| Performance | Extract design, workbook tuning, aggregation, filter design | 2 to 3 |
| Data sources | SQL Server, Snowflake, Azure SQL, Google BigQuery, Excel | 2 to 4 |
Skills section
Weak
Skills: Tableau, Dashboards, Reports, Bar Chart, Line Chart, Pie Chart, Maps, Treemap, Heatmap, Scatter Plot, Filters, Colour, Size, Tooltip, Calculated Fields, Data Visualisation, Excel, MS Office
Strong
Calculations: LOD expressions, table calculations, calculated fields, parameters. Data prep: data sources, joins, extracts, Tableau Prep, SQL. Server: Tableau Server, certified data sources, row-level security. Performance: extract design, workbook tuning.
Cuts the chart-type padding, keeps the skills that take judgement, and groups the rest so a human reads it in one pass.
Projects and portfolio: what to include and how to describe it
For a fresher, projects are the resume. They sit above experience, they get the most space, and they are where a reviewer decides whether you can actually model and visualise data in Tableau or only follow a tutorial. For an experienced developer they move below experience and shrink to one or two entries, kept only if they show something the day job does not. The common failure is describing the tool instead of the analysis. "A sales dashboard built using Tableau with multiple charts and filters" tells a reviewer nothing, because thousands of resumes carry that exact line. Describe the dataset, the one question the workbook answers, and the data or calculation decision that was genuinely hard. The airline delays workbook in the fresher sample is a strong entry because it names the row count, answers one question per sheet, and states a real choice: an extract at two million rows and a LOD expression a simple average could not compute. Tableau Public is a genuine advantage that many candidates underuse. A published workbook an interviewer can open and explore is worth more than a screenshot, so build two or three, name them in plain text, and make sure the calculations hold up before you link them. Pick projects that show range: one with a large dataset for performance, one that demonstrates a concept like LOD or row-level security, and one built on messy data that needed real Tableau Prep work. Two well-described projects beat five listed by name. Describe the hard part, not the chart gallery.
Project description, fresher resume
Weak
Airline Dashboard: an interactive dashboard built using Tableau with charts, filters and maps for flight delay analysis.
Strong
Airline delays dashboard: a three sheet workbook on a two million row dataset, built on an extract for performance, answering one question per sheet and using a LOD expression for average delay per carrier that a simple average could not compute correctly.
Swaps a tool list and "charts and filters" for the dataset size, the performance decision and the specific calculation the project needed.
Where education and certifications belong
Education goes at the bottom for anyone with a full-time job, and near the top for a fresher, who has nothing stronger to lead with. Degree, institution, years. That is the whole entry for most people. Tableau hiring is unusually open on degree: commerce, economics, statistics and engineering backgrounds all appear, so do not assume you need a computer-science degree to be read. CGPA or percentage is worth keeping while you are a fresher and it is good, roughly 7.5 out of 10 and above, because campus and early-career screening still filters on it. Once you have your first full-time role, drop it. A number from four years ago competes for space with workbooks that are far more predictive. Coursework lines are for freshers only, and only when relevant. Statistics, databases and data-visualisation courses are worth naming for a BI role. A generic humanities list is not. Skip school details once you have a degree. Certifications sit just below education, or beside skills if you hold only one or two. Write the full name, the issuing body and the year. For Tableau the Desktop Specialist is the entry credential and the Certified Data Analyst the working developer's badge, both weighted with service companies and in early-career hiring. The Server Certified Associate matters for senior and administration roles. An expired certification listed as current is a small dishonesty that is easy to catch, so renew it or remove it.
Getting through the applicant tracking system
An applicant tracking system is a parser and a search index, not a judge. It reads your file, tries to break it into name, dates, employers, titles and skills, and stores the result so a recruiter can search across candidates. Almost every ATS problem is a parsing problem, and parsing problems come from layout, not wording. The layout rules are short. One column. Standard section headings, so use Work Experience rather than My Journey, and Skills rather than My Toolkit. No text inside images, because a tool-logo strip reads as empty space. No critical information in the header or footer region, which some parsers drop. Avoid text boxes and nested tables in the resume body. On wording, mirror the language of the job description where it is honest. If the posting says LOD expressions, write LOD expressions. If it says Tableau Server, write Tableau Server rather than only Tableau. Include the expansion alongside an acronym at least once, for example "LOD (level of detail) expressions" and "RLS (row-level security)", so both searches find you. Keyword stuffing does not work, and BI resumes are a common offender with a hidden block of every chart type in white text. Recruiters find it quickly, and the outcome is worse than being filtered. Write real bullets that naturally contain the right terms, because a bullet describing an aggregated extract contains the word extract in a context that survives human review too. Save as PDF from your editor, then open the file and confirm you can select and copy a sentence. If you cannot select the text, neither can the parser.
Section heading
Weak
My Analytics Story
Strong
Work Experience
Parsers look for standard headings; a creative one can push the entire block into an unclassified bucket the recruiter never searches.
Test your own file before you send it. Copy the text out of the PDF into a plain text editor. Whatever you can read there is roughly what the parser sees, and anything scrambled is a real risk.
What gets Tableau developer resumes rejected
Most rejections at the resume stage are not close calls. They come from a small set of recurring problems, and all of them are fixable in an afternoon. The list below covers what reviewers of Indian Tableau resumes see most often, in rough order of how much damage each one does.
- Leading with a dashboard count instead of a data source. "Built 40-plus dashboards" says nothing about whether the numbers were right or the workbook opened.
- Every chart type listed as a separate skill. Bar, line, map and treemap are how the tool works, not ten skills.
- No numbers anywhere. Load time, refresh time, manual hours removed, workbooks consolidated, users. Pick whichever is honest.
- Job duties copied from the job description instead of what you shipped. "Responsible for developing dashboards" is the tell.
- No SQL or data-source depth for a role that clearly needs it, so a reviewer cannot tell whether you can go past a single flat file.
- A photo, date of birth, marital status or father's name. None of it belongs on a technical resume, and it takes a project's space.
- A generic objective line. Replace it with a summary that states stack, years and one result.
- No mention of performance work, when a slow workbook is the single most common complaint a Tableau team fields.
- Inflated titles or dates that do not match your payslips and offer letters. Background verification is standard and a mismatch ends the process.
- Typos in the tools you claim to know. Writing "Tableau" as "Tablaeu" or "Hyper" as "Hypre" undoes an otherwise strong page.
Read your resume aloud once before sending it. Anything you would be embarrassed to say to an interviewer's face is a line to cut or rewrite.
Skills to put on a tableau developer resume
Technical
- LOD Expressions
- Table Calculations
- Calculated Fields and Parameters
- Data Source Design and Joins
- Extract Design and Hyper
- Row-Level Security
- Workbook Performance Tuning
- Data Blending
- SQL and T-SQL
- Data Warehousing Concepts
- Dashboard Design and Actions
- Data Visualisation
Tools and platforms
- Tableau Desktop
- Tableau Server
- Tableau Cloud
- Tableau Prep
- SQL Server
- Snowflake
- Azure SQL
- Google BigQuery
- Excel
- Git
- Python (basic)
- Alteryx (basic)
Working skills
- Requirement gathering
- Stakeholder communication
- Data storytelling
- Documentation
- Content governance
- Mentoring
- Attention to detail
- Cross-functional collaboration
- Estimation and planning
Certifications worth listing as a tableau developer
| Certification | Full name | Worth it for |
|---|---|---|
| Desktop Specialist | Tableau Desktop Specialist | The entry-level Tableau certification and the one that carries most weight with service companies and in campus and early-career hiring, where it is a clean signal for a fresher with no BI job history. It does not expire, which makes it a low-risk first credential. Product and analytics teams care less once you have shipped workbooks to point at. |
| Certified Data Analyst | Tableau Certified Data Analyst | The working developer's certification, covering data preparation, calculations, dashboards and sharing. Worth it in the one-to-five-year range to prove end-to-end Tableau capability, and the badge many mid-level BI postings ask for. It supersedes the older Certified Associate. |
| Server Certified Associate | Tableau Server Certified Associate | For developers who administer or heavily publish to Tableau Server: sites, permissions, extract schedules and governance. Worth it for senior developers and BI leads who own the server estate, and less relevant if you only build workbooks and never touch administration. |
| SnowPro Core | SnowPro Core Certification | Not a Tableau badge, but a strong pairing for a Tableau developer whose warehouse is Snowflake, which many Indian enterprises now run. Worth it if you write the SQL and design the sources behind your dashboards, and it widens you toward the data-engineering-adjacent roles that pay more. |
| Azure DP-900 | Microsoft Certified: Azure Data Fundamentals | A light cloud-data credential worth it for a Tableau developer working against Azure SQL or Synapse who wants the cloud keywords on the page. Most useful in the zero-to-three-year range; senior developers who already run production cloud workloads can skip it. |
Keywords an ATS scans for in a tableau developer resume
These are the literal terms a parser matches against the job description. Use the ones that are true of you, in the sentences where you did the work, not as a list at the bottom.
- tableau developer
- bi developer
- tableau
- LOD expressions
- table calculations
- calculated fields
- tableau server
- tableau prep
- data source
- data extract
- row-level security
- SQL
- data visualisation
- dashboard design
- workbook performance
- snowflake
- data blending
- certified data source
- tableau cloud
- business intelligence
Tableau Developer resume FAQ
What salary can a Tableau developer expect in India?
A fresher typically starts around 3.5 to 6 LPA in service companies and higher in product and analytics firms. A Tableau developer with four to six years on enterprise dashboards usually sits in the 8 to 16 LPA band. Senior developers and BI leads with nine years and above commonly earn 18 to 32 LPA and more at strong product companies. Real data-source, LOD and performance depth, plus SQL and a warehouse credential like SnowPro, pushes the top of every band upward, because most resumes stop at drag-and-drop charts.
How long should a Tableau developer resume be?
One page up to about six years of experience, two pages after that only if the second page carries real data-source and server work rather than a longer list of chart types. Nobody has been rejected for a resume that was too easy to read. If you are struggling to fit one page, cut the oldest role to a single line, remove coursework, and delete any feature you would not want to be interviewed on.
Should I list every Tableau chart type as a skill?
No. Bar charts, line charts, maps and treemaps are how the tool works, not separate skills, and listing them as ten items reads as padding an interviewer sees through in seconds. List the things that take judgement: LOD expressions, table calculations, data-source design, extract tuning and row-level security. Let a bullet prove each one, because a feature you cannot back with a real workbook costs you more in the interview than it gains in the search index.
Is Tableau enough, or do I need SQL too?
For most Tableau developer roles in India you need SQL, and its absence is a common reason a strong-looking resume stalls. Dashboards are only as good as the data feeding them, and much of that comes from a database you query and shape before Tableau connects. Put SQL on the skills line, and where it is honest, show a bullet where you wrote the query or view that fed a workbook. It widens the roles you qualify for considerably.
Should a fresher put projects above work experience?
Yes. With no full-time BI roles, projects are the strongest evidence you can offer, so they sit directly under the summary. State the dataset, the one question the workbook answers, what you built and what was genuinely hard. Publish two or three to Tableau Public so an interviewer can open them, and pick projects that show range: one with a large dataset for performance, one that demonstrates a concept like LOD, and one built on messy data that needed real Tableau Prep work. An internship still goes in a separate experience section below projects.
Do Tableau certifications actually help?
They help most when you have little professional experience or are switching into BI, and least once you have shipped enterprise workbooks to point at. The Desktop Specialist and Certified Data Analyst carry weight in campus and service-company hiring and are often filters in job postings. For senior roles, data-source depth, LOD and server governance matter far more than any certificate, so keep the list short and current.
How do I show Tableau work if my dashboards are confidential?
You cannot share a client's data, but you can describe the work: the number of source tables blended, the calculations, the load time you cut, the users served and the manual process you removed, none of which exposes anything sensitive. For a portfolio, rebuild a comparable dashboard on a public dataset in Tableau Public so an interviewer can open the workbook. Describing the data source and the result, not the raw numbers, is both safe and more persuasive than a screenshot.
Does an ATS reject resumes with two columns?
It does not reject them outright, but some parsers read multi-column layouts out of order, which interleaves your sidebar with your experience and produces nonsense in the recruiter's view. A single-column layout removes the risk, which is why all three samples above use one. Test your own file by copying the text out of the PDF into a plain text editor, and if it reads in order there it will most likely parse correctly.
Do I need a photo on a Tableau developer resume in India?
No. Technical and analytics recruiters do not expect one, and it takes space a project or a result should occupy. The same goes for date of birth, marital status, father's name, nationality and a declaration paragraph. These come from an older template that spread through campus placement cells and add nothing to a BI screen. The only exception is a client-facing role that explicitly asks for a photograph in the posting.
Related resume examples and guides
Build your own in any of these formats
Start from a blank resume or upload the one you have. Goodspace renders it in 24 templates and flags the LOD, data-source and Tableau keywords an applicant tracking system will look for, and the chart-type padding it will not credit.
Build my resume