Data Analyst Resume Format, with 3 Full Samples
A data analyst resume usually fails for one of two reasons. Either the applicant tracking system cannot find SQL, Python or the BI tool named in the job description, or a hiring manager finds a tidy list of tools and no evidence that a single decision changed. The role is unusual in that the entry ticket and the differentiator are completely different things: everyone applying can write a query and build a chart, so the page has to argue that your queries and charts were load-bearing. Below are three complete resumes, one each for a fresher or career switcher, a mid-level analyst with four years, and an analytics lead with eight, followed by the format rules, the bullet patterns, the certifications worth the money and the keywords that matter.
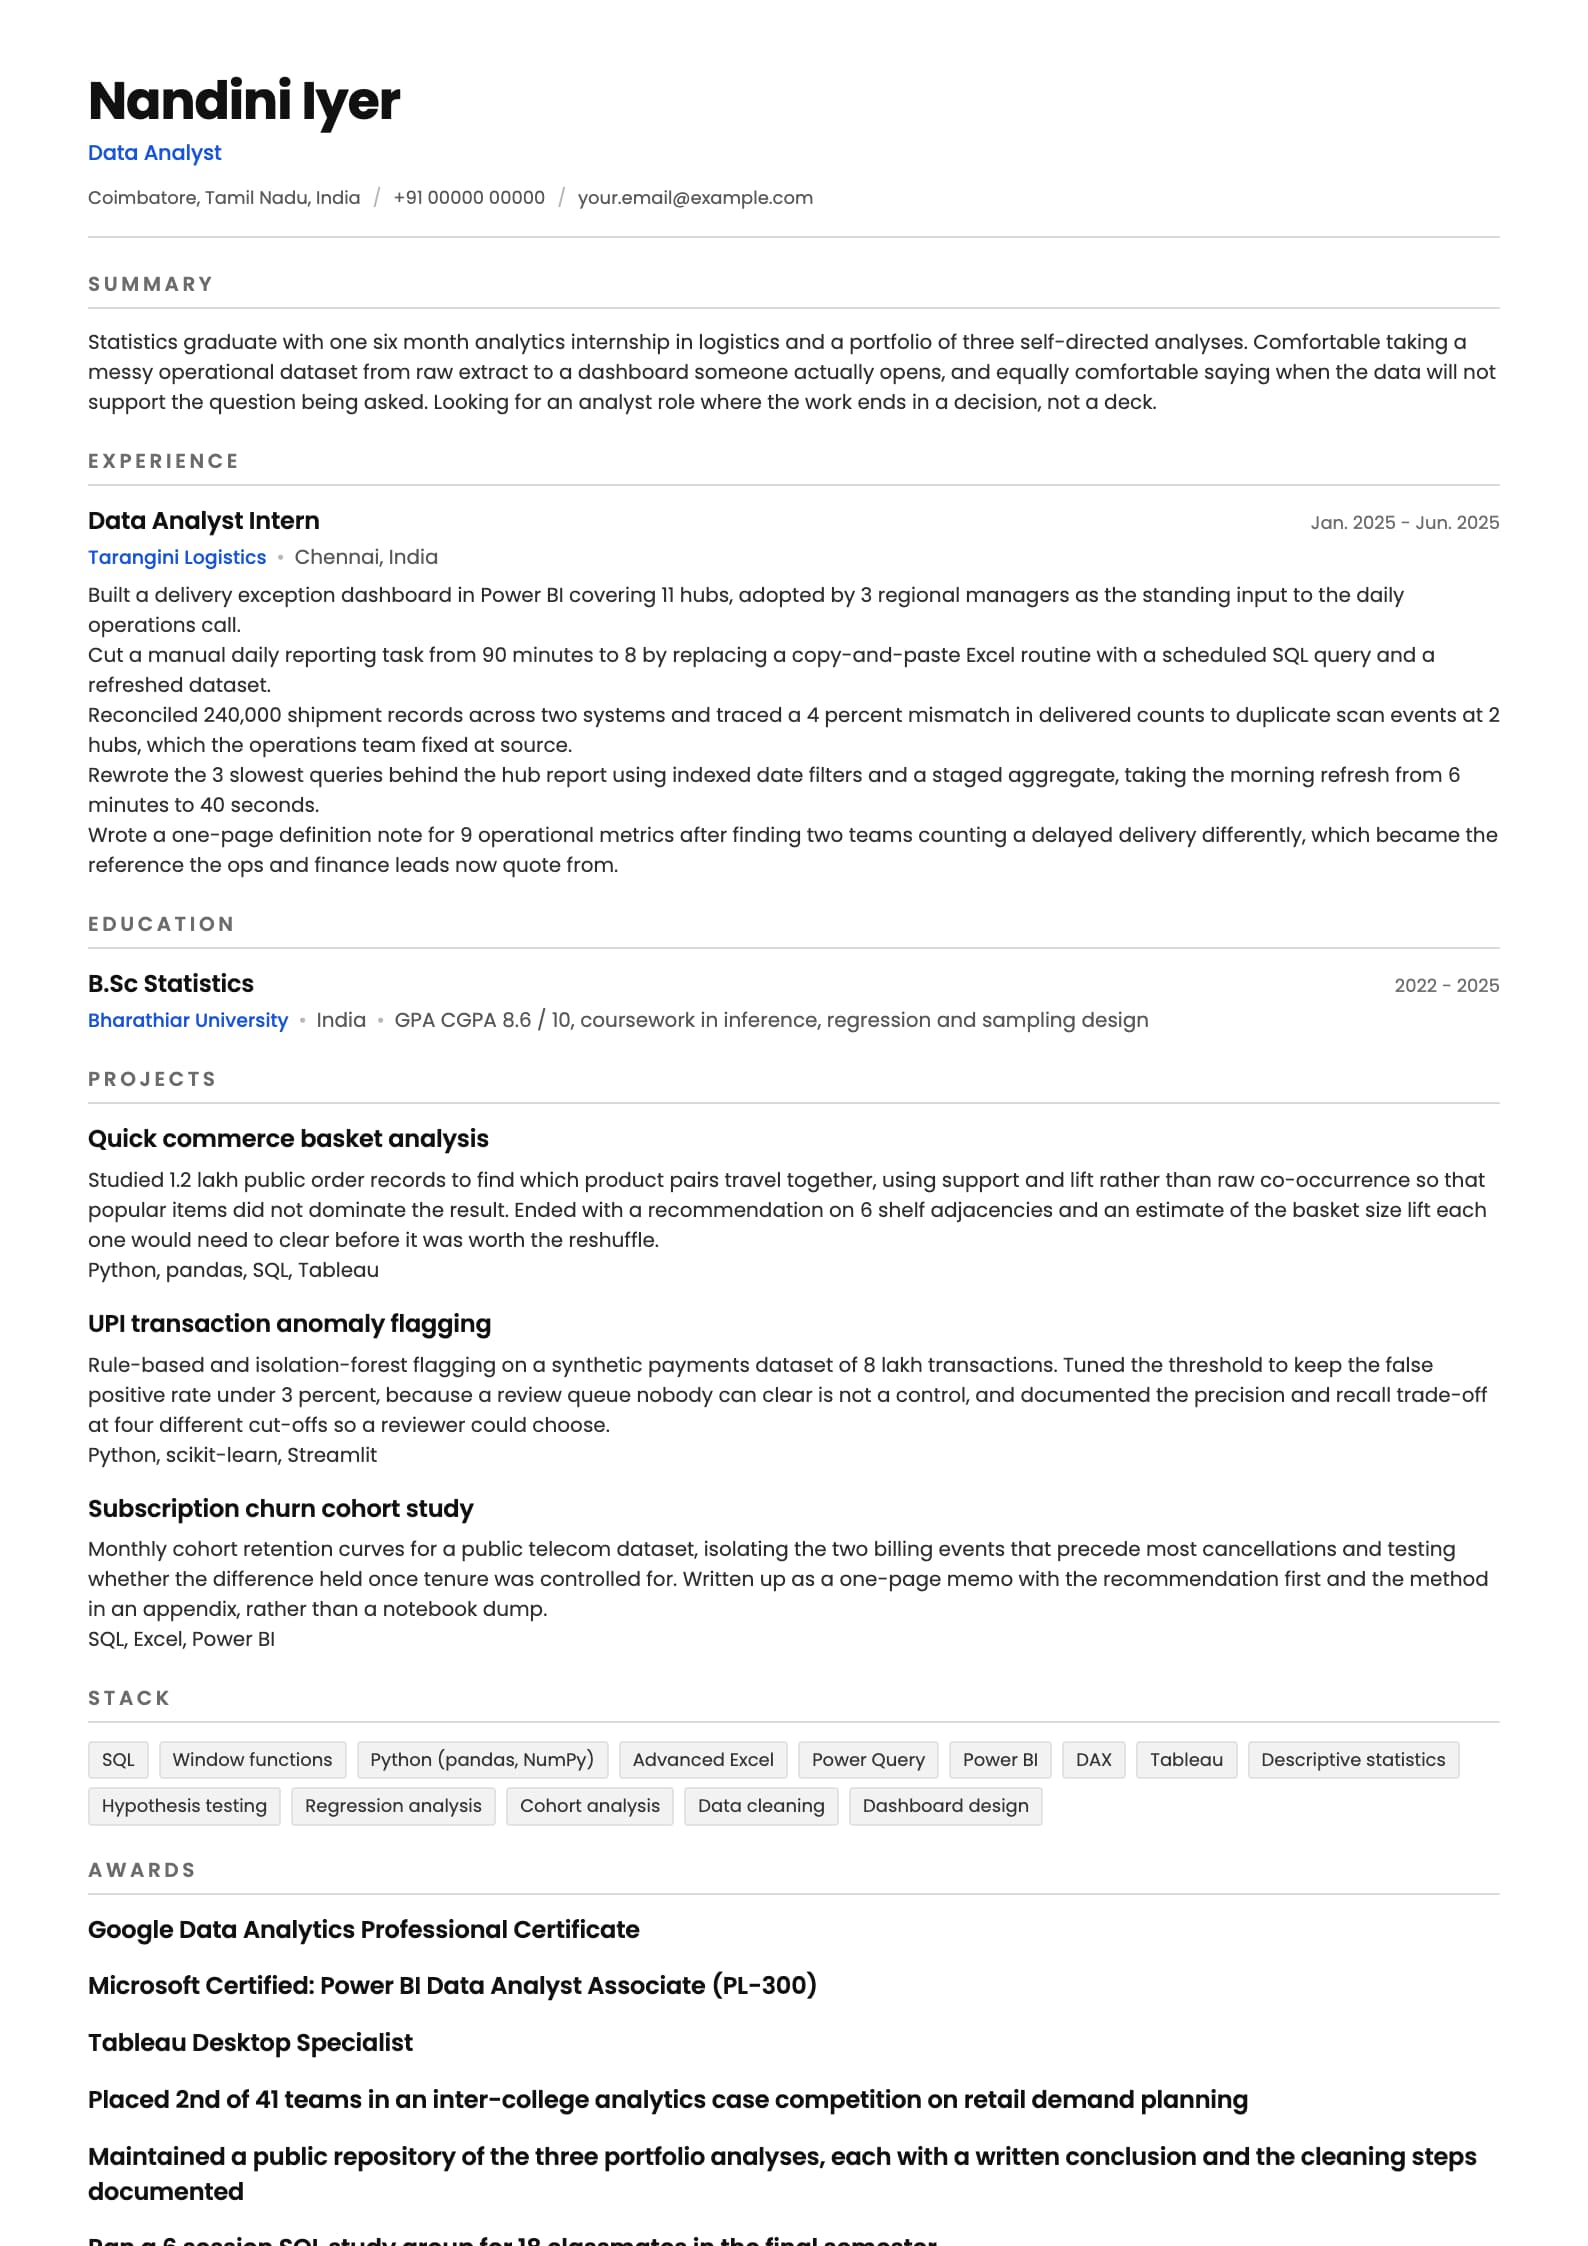
Build my resumeData Analyst resume example, Fresher or career switcher (0 years)
mono-tech templateIs your resume good enough?
Upload the resume you have now and see what an applicant tracking system reads before a data analyst recruiter ever does.
Free to run. Sign in with your mobile number to see your score.
Data Analyst resume example, Mid-level (4 years)
dense-two-col template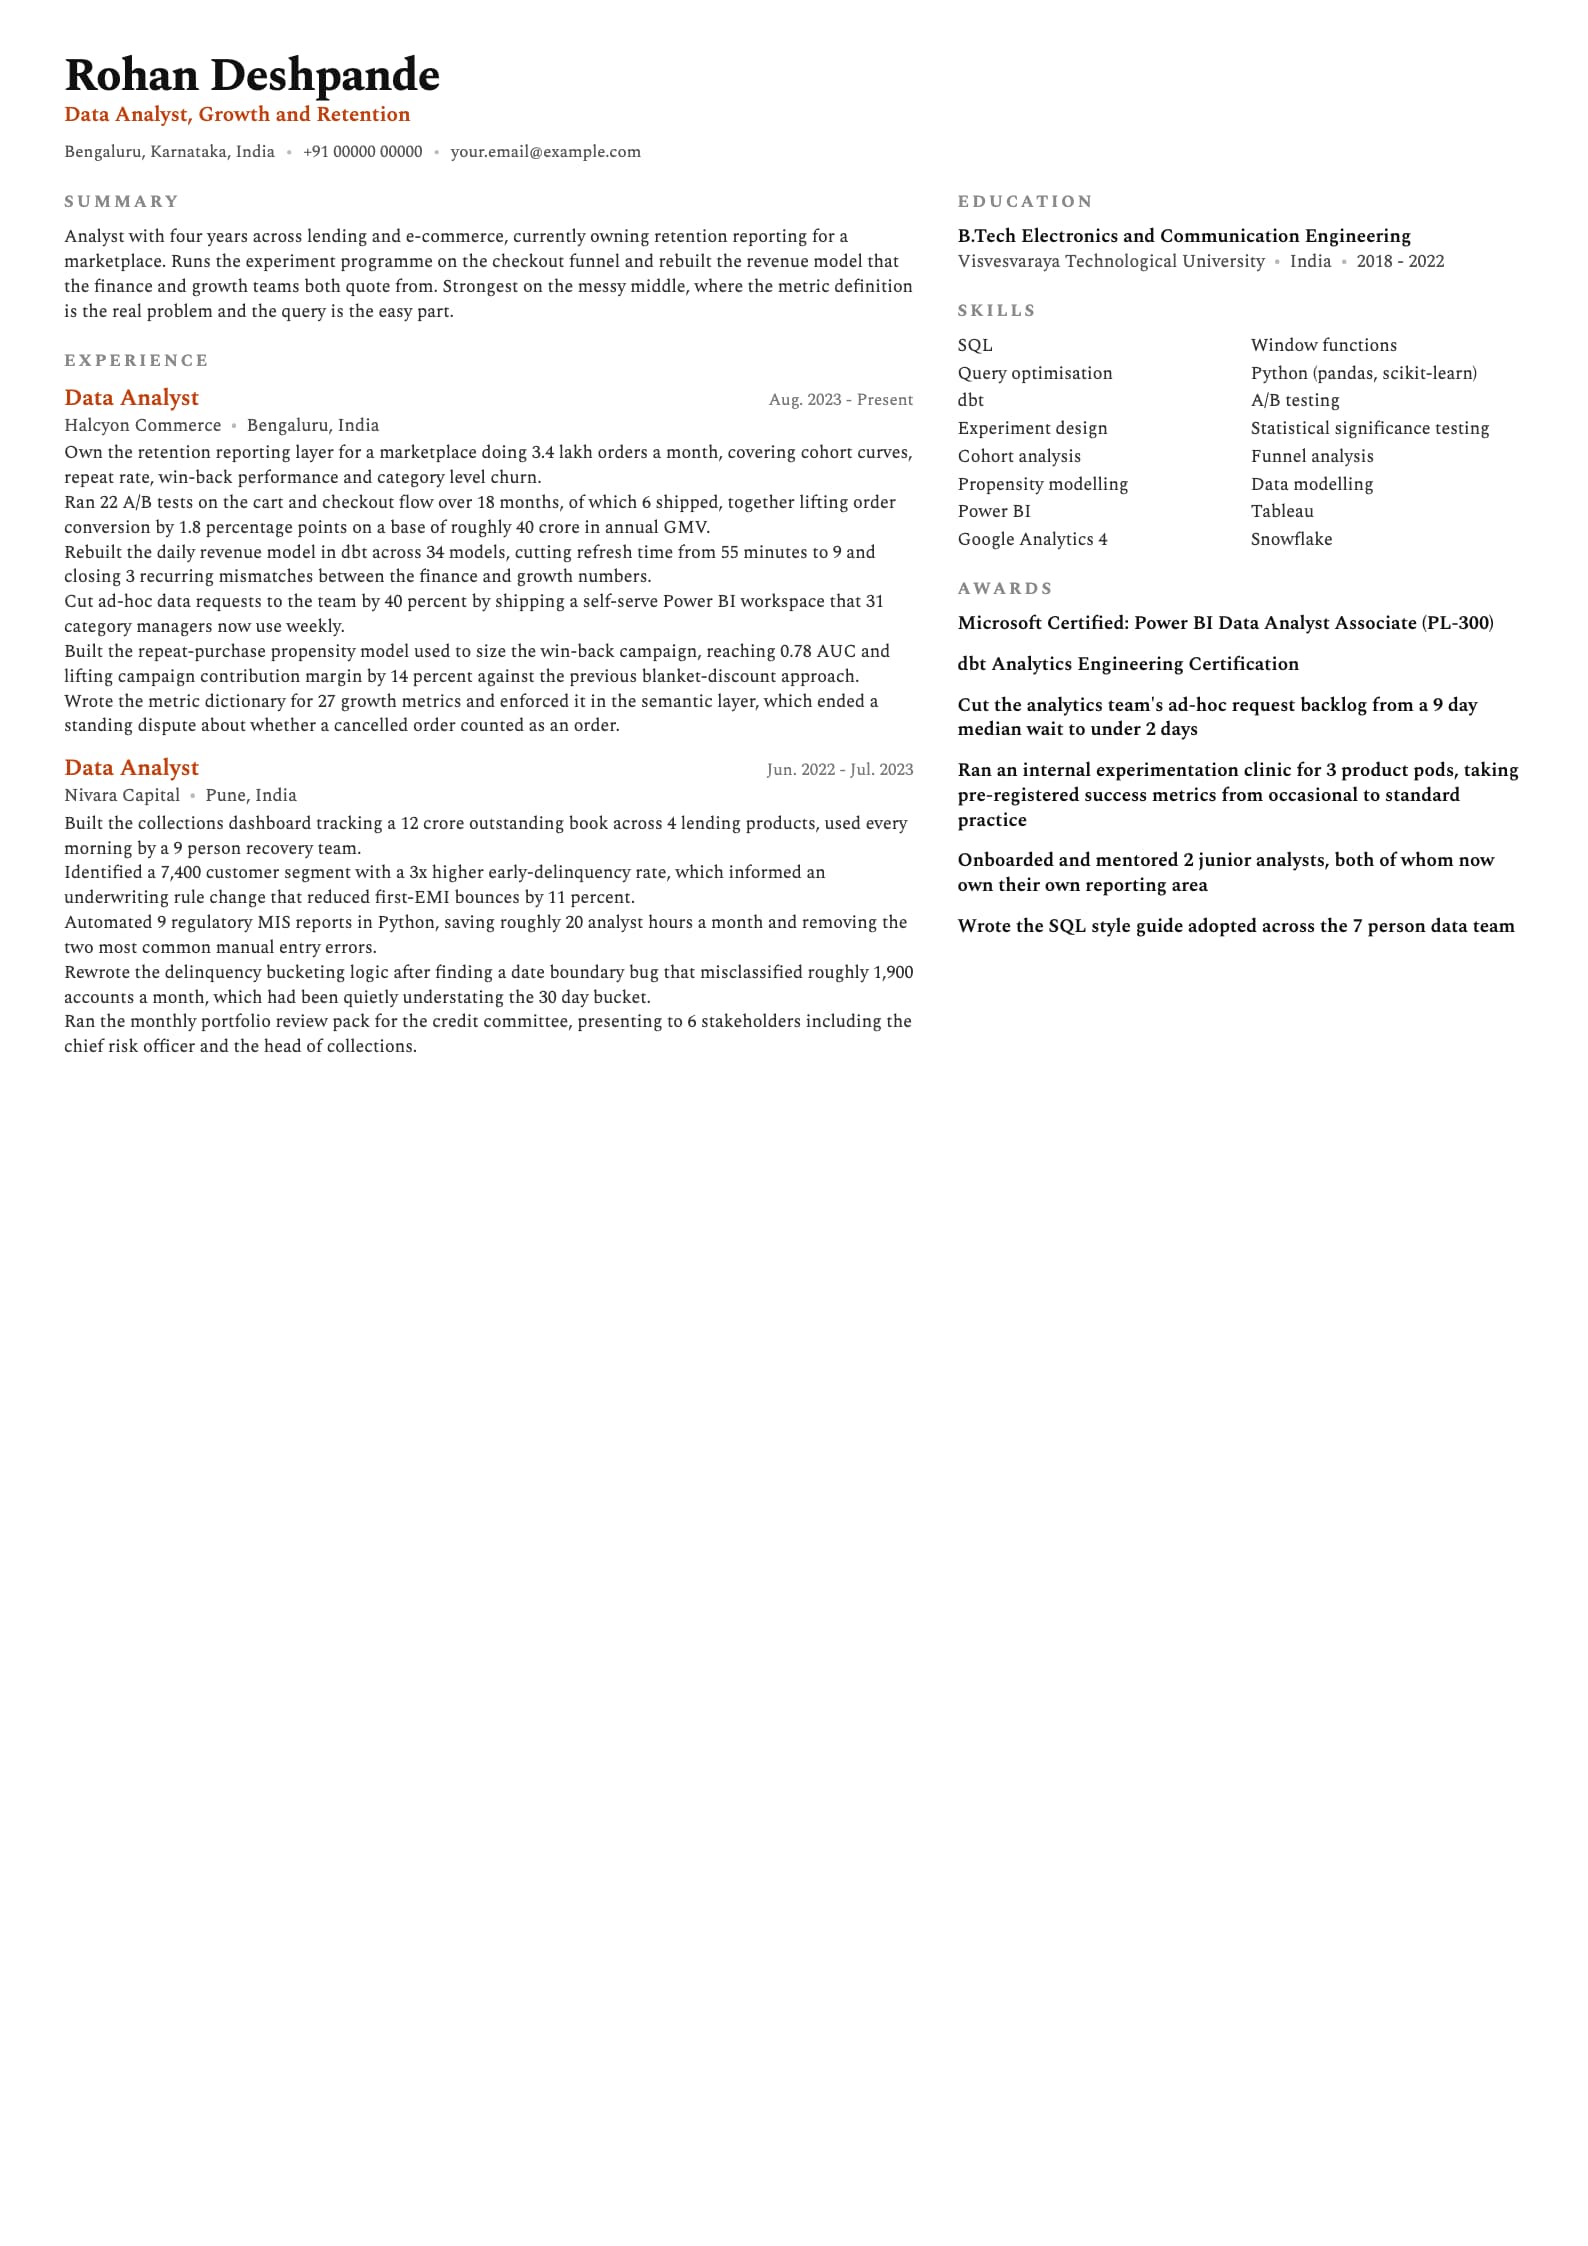
Want this structure with your own details? Build it in the resume builder.
Data Analyst resume example, Analytics Lead (8 years)
timeline template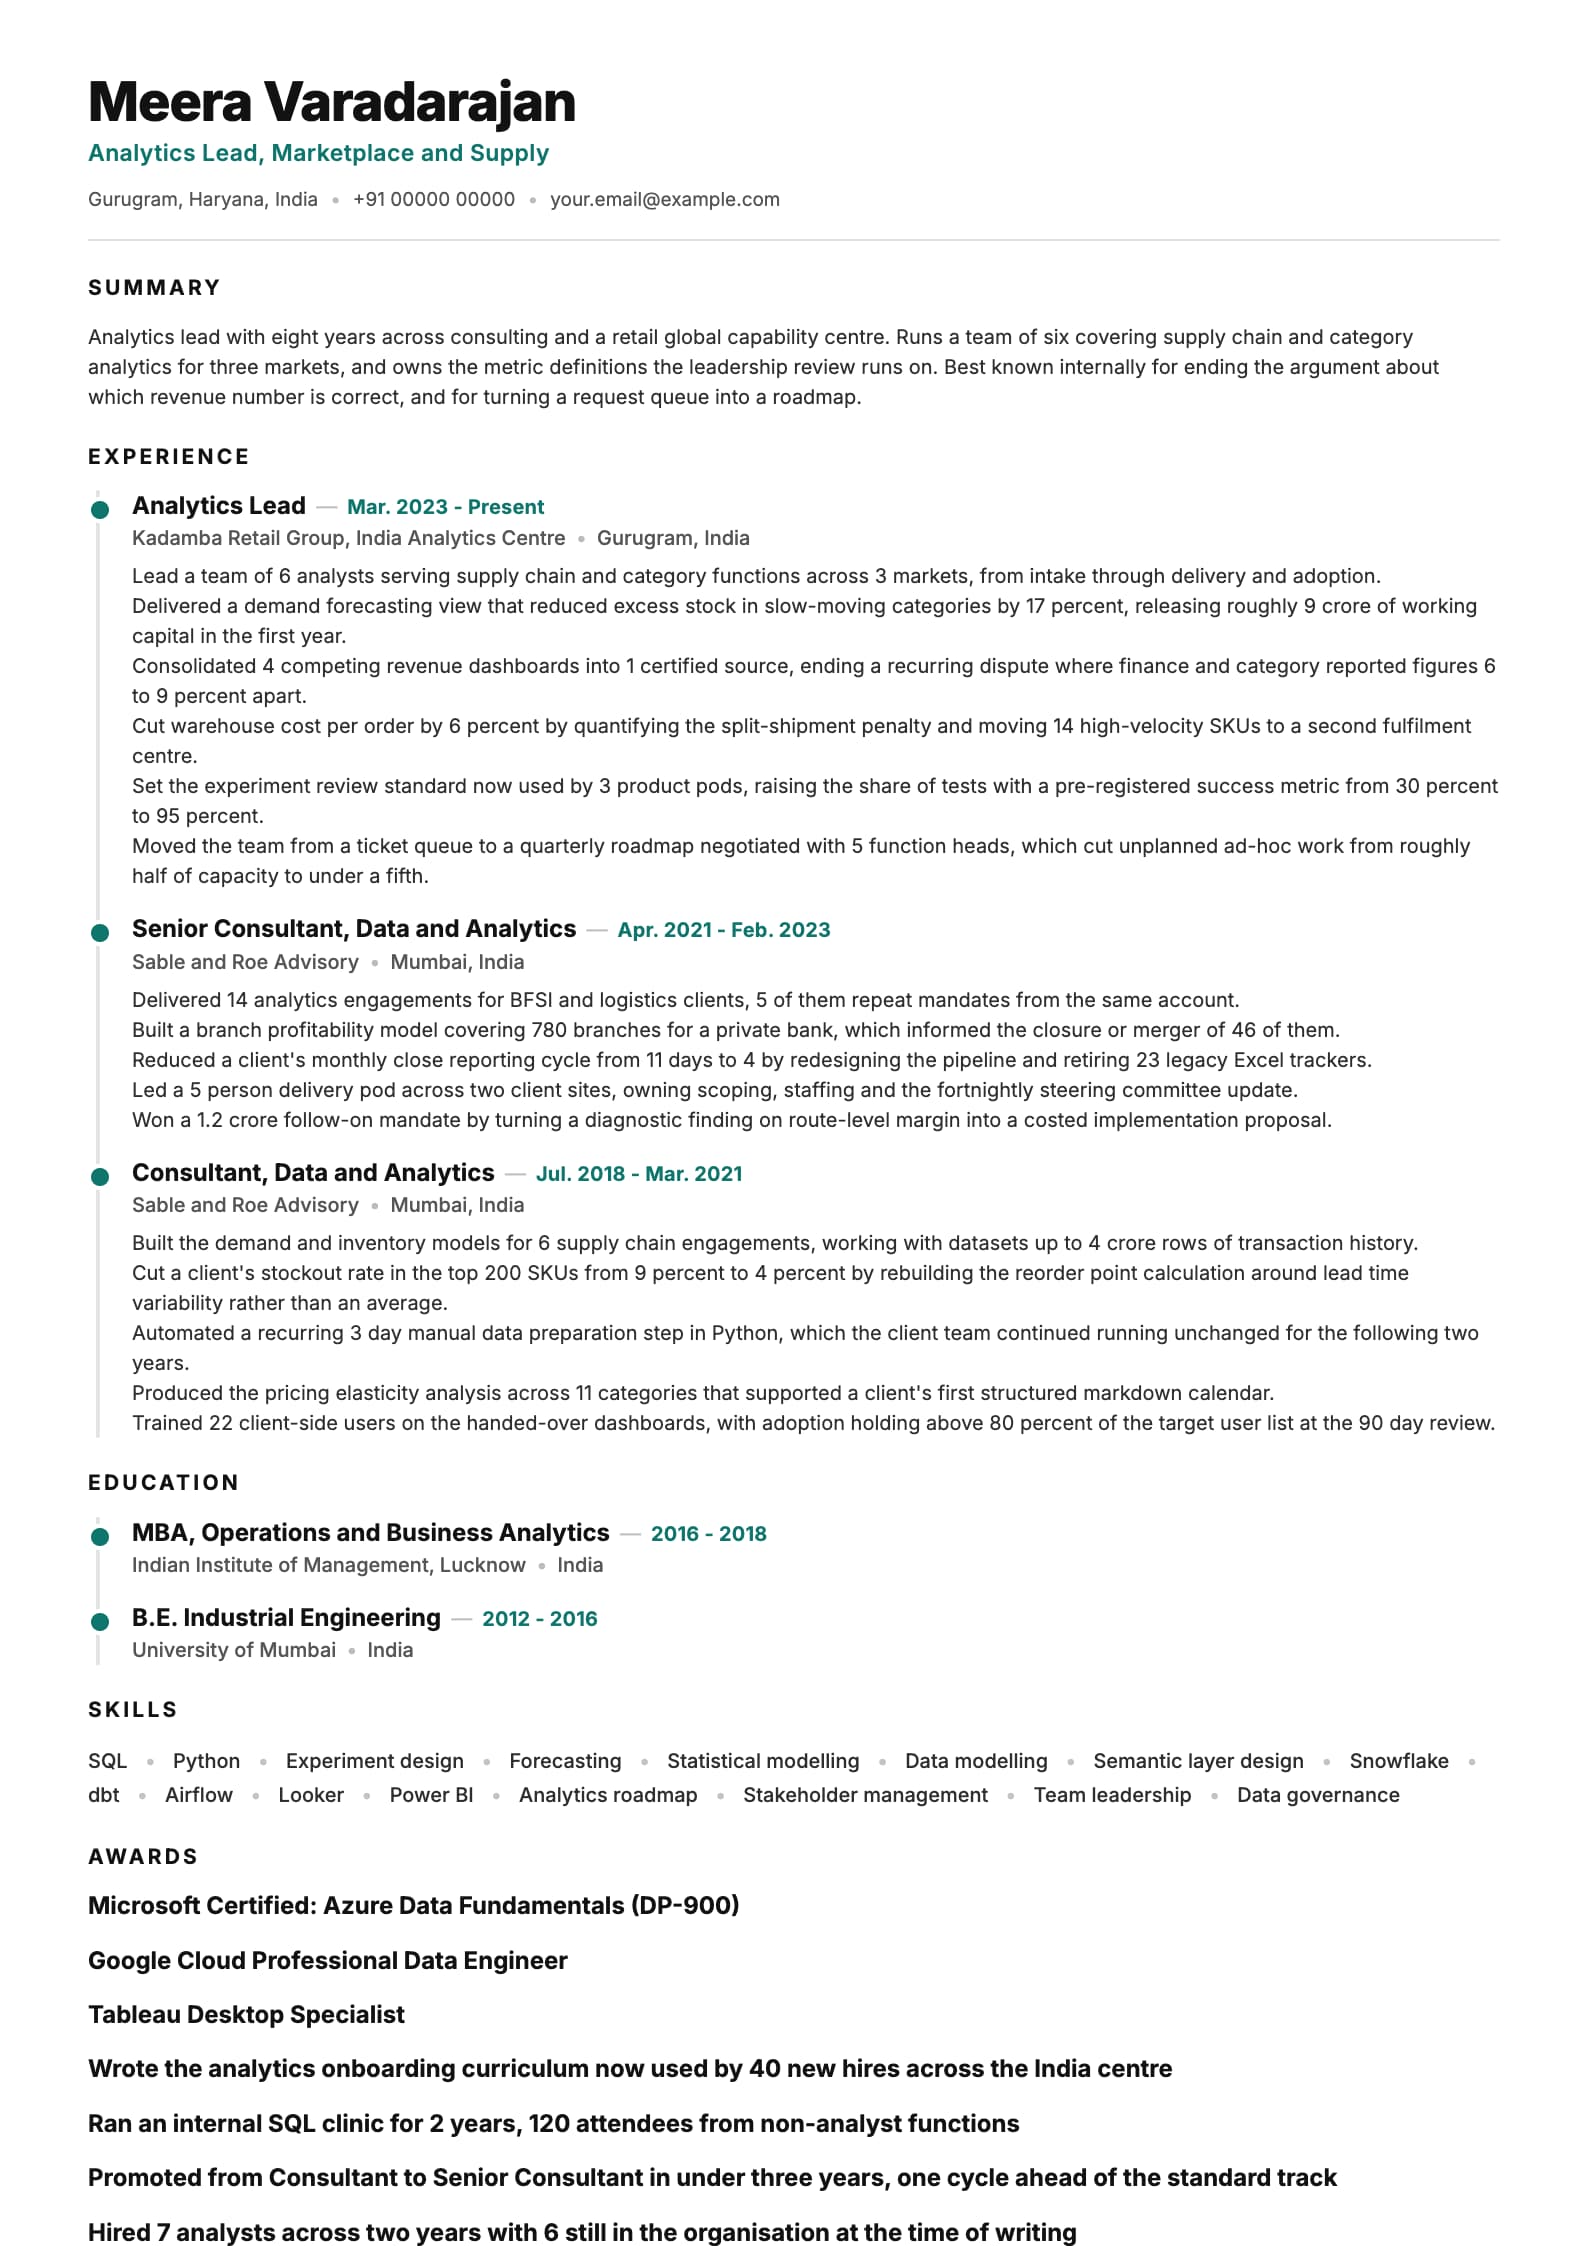
The format that works for data analyst resumes in India
Reverse chronological, one page until roughly six years of experience, two pages after that. No photo, no declaration line, no postal address, no table of personal details. All three samples above follow the same order, and the order is doing real work: it puts evidence before inventory. The reader reaches your results before they reach your tool list, which matters because the tool list is the part that looks like everyone else's. Keep the layout to a single column of body text if you can. Multi-column resumes look considered on screen and can parse in the wrong order in older applicant tracking systems, which turns a clean experience section into interleaved fragments. If you want visual structure, get it from spacing, rules and weight rather than from side-by-side columns, and keep the skills block as a labelled list rather than a grid of chips. Use a normal document font at 10 or 11 point, keep margins at least half an inch, and export to PDF unless the posting explicitly asks for a Word file. Name the file with your own name and the role, not resume_final_v4. One more thing that is specific to this role: analysts are tempted to embed a screenshot of their best dashboard. Do not. It parses as nothing, it inflates the file size, and the interesting part of that dashboard was the decision it changed, which is a sentence, not an image.
| Section | Where it goes | Why |
|---|---|---|
| Name and headline | Top, above everything | Write the role plus the domain you analyse, such as "Data Analyst, Growth". Recruiters filter on that line. |
| Professional summary | Directly under the header | Three lines. Years, domain, and the single strongest business result you can defend in an interview. |
| Work experience | Next, for anyone with a job | Most recent first. The current role gets the most bullets, older roles compress as they age. |
| Projects | Above experience for freshers and switchers, below it after that | With no analyst job yet, projects are the only evidence. Once you have one, they are supporting material. |
| Skills | Below experience | Grouped into languages, BI tools and methods. A wall of 30 items reads as noise to a human and adds nothing for the ATS. |
| Certifications | After skills | PL-300, Google Data Analytics and similar belong here. They support the experience, they do not stand in for it. |
| Achievements | After certifications, if you have real ones | Competitions, internal teaching, published analysis, promotions. Skip the section entirely rather than padding it. |
| Education | Bottom, unless you are a fresher | Degree, institution, years. Keep a statistics, maths or economics degree visible, drop the percentage after your first job. |
The professional summary, in three lines
The summary is the only part of the resume a busy hiring manager is guaranteed to read, and it is the part most analysts waste. The failure mode is generic ambition: a sentence about being a detail-oriented, data-driven professional seeking a challenging role in a reputed organisation. That sentence is on tens of thousands of resumes and it says nothing that could be false, which is the test for whether a claim is worth ink. If your summary could sit on a colleague's resume without a single edit, it is not a summary, it is a preamble. Write three lines and give each one a job. Line one is who you are in market terms: years of experience, the domain you analyse, and the function you sit closest to. Line two is what you own or have owned, stated concretely, such as the retention reporting layer, the experiment programme, or the forecasting view for three markets. Line three is your single strongest defensible result, with a number. That is it. No adjectives about your work ethic, no list of tools, no objective statement about what you are seeking unless you are a career switcher, in which case one clause explaining the pivot is worth the space because it answers the question the reader is already forming. Career switchers should name the previous domain as an asset rather than apologising for it. An analyst who spent four years in supply chain operations and now writes SQL understands fill rate and lead time in a way that a fresh graduate does not, and that is a hiring argument, not a gap to explain away.
Professional summary
Weak
Detail-oriented and data-driven data analyst seeking a challenging role in a reputed organisation where I can utilise my skills in SQL, Python, Power BI and Tableau to contribute to organisational growth.
Strong
Data analyst with four years across lending and e-commerce, currently owning retention reporting for a marketplace doing 3.4 lakh orders a month. Runs the checkout experiment programme, 22 tests in 18 months with 6 shipped. Rebuilt the revenue model that finance and growth now both quote from.
The rewrite replaces claims about the candidate with facts about the work, and every one of them can be interrogated in the interview.
Show business impact, not a tool list
This is the mistake analysts make more than any other. A resume that repeats SQL, Python, Tableau and Power BI in the summary, the skills block and every single bullet proves you can operate the software. It says nothing about whether a decision moved. Tools are the entry ticket for this role, so they cannot also be the differentiator, and a hiring manager reading forty applications has already seen your exact tool list thirty-nine times. The mental model that fixes this is simple: every bullet should be able to answer the question so what. You built a dashboard, so what. Someone opened it, so what. They changed a reorder point, and stockouts fell. That last clause is the bullet. The first two are the setup you can compress into a phrase. Analysts resist this because the causal chain feels dishonest, since the analyst rarely makes the decision themselves. That instinct is worth respecting and it has a clean solution: use the verb that describes your actual contribution. Informed, supported, surfaced, quantified and enabled are all honest verbs, and none of them claim you personally shut the branches. "Built a branch profitability model covering 780 branches, which informed the closure or merger of 46" is both true and strong. The other habit worth building is scale. A reader cannot calibrate your work without knowing whether you queried four thousand rows or four crore, whether your dashboard served three people or three hundred, whether the book was 12 crore or 1,200 crore. Scale is almost never confidential and it is the cheapest credibility you can add to a page.
- Name a metric the business already tracks: repeat rate, cost per order, delinquency, fill rate, conversion, churn, contribution margin. Not "insights" and not "data-driven decisions".
- Say who used the output and how often. A dashboard nobody opens is not an achievement, which is why "31 category managers use it weekly" beats "built dashboards".
- State the decision that followed. "Informed the closure or merger of 46 branches" carries far more than "analysed branch performance".
- Keep tool names attached to the thing they produced, inside the bullet, and let the skills section carry the full list exactly once.
- Give the reader a sense of scale, in rows, orders, book size, users or markets, so they can tell whether you queried 4,000 records or 4 crore.
- Where you genuinely did not own the decision, use an honest verb: informed, quantified, surfaced, enabled. It reads as more senior, not less.
Experience bullet, dashboard work
Weak
Created and maintained multiple interactive dashboards in Power BI and Tableau for various business stakeholders across the organisation.
Strong
Cut ad-hoc data requests to the team by 40 percent by shipping a self-serve Power BI workspace that 31 category managers now use weekly.
Same work, but the rewrite names who uses it, how often, and the operational cost it removed instead of counting artefacts.
If your five best bullets all stop at the deliverable, you have written the job description of a data analyst rather than a record of one. Recruiters have read a thousand of those this quarter.
Experience bullets: action, dataset, decision it changed
The pattern in all three samples is identical: action verb, what you built or found, what changed because of it. The number does the persuading, and the verb keeps the sentence from drifting into passive team-speak. Two structural rules make bullets scannable. First, front-load. The first four or five words decide whether the rest gets read, so the verb and the object go first and the method goes last. "Cut the morning refresh from 6 minutes to 40 seconds by rewriting three queries around an indexed date filter" is read; "By rewriting three queries around an indexed date filter, the morning refresh was reduced" is skimmed past. Second, keep each bullet to one idea and roughly two lines. A four line bullet containing three achievements will be read as one achievement, and the two you buried are wasted. Split them or cut the weakest. On quantity: give your current role five or six bullets, the one before it four or five, and anything older three. This taper is a signal in itself, because a resume where a role from 2019 has as much detail as the current one reads as someone whose best work is behind them. Vary your verbs, but not for the sake of variety. Built, ran, cut, rebuilt, identified, automated, owned, led, set and delivered cover almost every honest analyst achievement. Avoid spearheaded, orchestrated and leveraged, which read as inflation and are the words interviewers quote back sarcastically. Finally, never start a bullet with "responsible for". It describes the job you were given rather than the work you did, and it is the single most common opening line on a rejected analyst resume.
- Weak: "Responsible for creating daily and weekly reports for the business team."
- Strong: "Cut ad-hoc data requests by 40 percent by shipping a self-serve Power BI workspace that 31 category managers now use weekly."
- Weak: "Worked on SQL queries and Tableau dashboards for stakeholders."
- Strong: "Rebuilt the daily revenue model in dbt across 34 models, cutting refresh time from 55 minutes to 9 and closing 3 recurring mismatches between finance and growth."
- Weak: "Performed data analysis to identify trends in customer behaviour."
- Strong: "Identified a 7,400 customer segment with a 3x higher early-delinquency rate, which informed a rule change that reduced first-EMI bounces by 11 percent."
- Weak: "Involved in A/B testing activities for the product team."
- Strong: "Ran 22 A/B tests on the cart and checkout flow over 18 months, of which 6 shipped, together lifting order conversion by 1.8 percentage points."
Experience bullet, data quality work
Weak
Handled data quality checks and validation activities to ensure accuracy of reports on a regular basis.
Strong
Rewrote the delinquency bucketing logic after finding a date boundary bug that misclassified roughly 1,900 accounts a month, which had been understating the 30 day bucket.
Data quality work only reads as valuable when the reader learns what was broken, how big it was, and what it was distorting.
Experience bullet, automation
Weak
Automated various manual reports using Python scripts, resulting in significant time savings for the team.
Strong
Automated 9 regulatory MIS reports in Python, saving roughly 20 analyst hours a month and removing the two most common manual entry errors.
"Significant" is a word people use when they did not measure. Nine reports and twenty hours is checkable, and the error removal adds a second benefit the vague version hid.
If a bullet would read identically on the resume of everyone else on your team, it is describing the team. Rewrite it until it only fits you.
Signalling real SQL, Python and statistics depth
Every analyst resume in the pile says SQL and Python. The word alone carries no information, so the reader falls back on the evidence around it, and you can control that evidence. The way to signal SQL depth is not to write advanced SQL in the skills line, which is unverifiable and mildly irritating. It is to have a bullet somewhere that could only have been written by someone who works in SQL past the SELECT statement: a query you optimised and by how much, a window function that replaced a manual ranking process, an incremental model that stopped a full table rebuild, a schema you designed and the join path it removed. One such bullet does more than any self-assessed proficiency label. The same holds for Python. Listing pandas, NumPy and scikit-learn tells the reader you finished a course. Naming what you automated, how long it used to take, and whether anyone still runs it tells them you shipped something. Statistics is the axis most analyst resumes skip entirely, and it is the one that separates candidates in interviews. If you have run experiments, say how you sized them, what you pre-registered, and what you did about the tests that lost. If you have built a model, give it one line with an honest metric and the business outcome, then stop. A single credible modelling bullet signals range; four of them turn an analyst resume into a weak data scientist resume that will lose to actual data scientists. Be careful with proficiency labels generally. If you write expert next to anything, expect the interview to open there.
| If your resume claims | The interview will expect | So the resume should show |
|---|---|---|
| SQL | Joins, aggregation, window functions, and a view on why a query is slow | One bullet with a runtime you improved, or a model or view you designed |
| Python | pandas beyond tutorials, plus something that runs on a schedule | What you automated, the time it used to take, whether it still runs |
| A/B testing | Sample sizing, what you pre-registered, how you treat a losing test | Number of tests run, number shipped, the aggregate effect |
| Forecasting | Baseline comparison, error metric, and what the forecast was used for | The business decision it fed and the inventory or capacity effect |
| Machine learning | Feature choices, validation approach, and why the model beat a rule | One bullet with an honest metric and the margin or cost outcome |
| Power BI or Tableau | Data model design, not just visual choices | Adoption numbers and the reporting workload the dashboard removed |
Skills line
Weak
SQL (Expert), Python (Advanced), Excel (Expert), Power BI (Advanced), Tableau (Intermediate), R (Basic)
Strong
SQL, Window functions, Query optimisation, Python (pandas, scikit-learn), dbt, A/B testing, Cohort analysis, Power BI, Tableau, Snowflake
Self-assessed levels are unverifiable and invite an interrogation you did not ask for. Naming the specific techniques does the same job and is checkable.
Portfolio projects, and picking a domain to be known for
For a fresher or a career switcher, projects are the resume. For everyone else they are supporting material that should be short or absent. The difference between a project that helps and one that hurts is whether it looks like an assignment. A titanic survival notebook, an iris classifier and a stock price predictor built from a tutorial are all recognisable on sight, and they signal that you completed a course rather than answered a question. A project that helps has four parts on the page: the question, the data and its scale, the method choice with one word about why, and the conclusion someone could act on. Two or three of those beat eight of the other kind. Pick data that is close to a real business. Public order data, transaction data, telecom churn data, government open data on transport or agriculture, and scraped listings all work, because the questions they support are questions someone gets paid to answer. Then write the conclusion first. A one page memo that opens with the recommendation and puts the method in an appendix demonstrates the exact skill an analyst is hired for, which is compressing analysis into a decision. A notebook full of charts demonstrates that you can make charts. The second half of this is domain. After two or three years, the strongest analyst resumes are not the ones with the longest tool list, they are the ones where a reader can immediately say what kind of analyst this is. Growth and retention. Credit risk. Supply chain. Marketing mix. Healthcare operations. Domain fluency is what makes you useful in week one rather than month three, and it shows up in the metrics you name, not in a line claiming domain expertise. If you are changing domains, keep the metrics from the old one visible and add a project in the new one, so the page argues that your judgement transfers even though the vocabulary is new.
- Lead each project with the question, not the dataset. "Which product pairs travel together, and is any of it worth a shelf change" beats "analysis of a retail dataset".
- State the data volume. It is the fastest way to show that you have handled something larger than a spreadsheet.
- Name the method choice and the reason in one clause, such as using lift instead of raw co-occurrence so popular items did not dominate.
- End with a recommendation and its condition, including the threshold at which the recommendation stops being worth it.
- Three finished analyses with written conclusions beat ten notebooks. Delete the tutorial ones rather than padding.
- Once you have two years of experience, cut projects to a single line each, or drop the section and give the space to your current role.
Quantifying when the real numbers are confidential
Analysts in BFSI, consulting and global capability centres often cannot publish absolute revenue, client names or portfolio size. That is a reason to change the unit, not to drop the number, and the resumes that handle this well read as more trustworthy rather than less. The instinct to go vague is understandable and it is the wrong trade, because a page with no numbers on it reads as a page with nothing to report. Start by asking what part of the claim is actually restricted. Usually it is the absolute money figure and the client name, and almost never the percentage change, the cycle time, the headcount served, the row count, or the number of markets. So convert. A 6 crore saving on an undisclosable base becomes a 6 percent reduction in cost per order. A client you cannot name becomes a private bank with 780 branches, which tells the reader more about the scale of the work than the brand would have anyway. A portfolio you cannot size becomes four lending products and a nine person recovery team. If even the percentage is sensitive, fall back on effort and adoption, which are yours to describe: the reporting hours removed, the number of stakeholders on the review, the days cut from a close cycle, the share of the target user list still active at ninety days. Two cautions. Do not invent a proxy that flatters more than the truth, because a hiring manager in the same industry will do the arithmetic in their head and you will spend the interview defending it. And if you are under a strict agreement, a short line saying figures are indexed or expressed as relative change is better than a page of unexplained percentages.
- Swap the absolute for a relative: percentage change, ratio, or a multiple such as 3x.
- Use the size of the thing you served instead of the money it made, such as branches covered, markets supported, or people using the output.
- Describe the client by sector and scale, for example "a private bank with 780 branches", rather than naming it.
- Use time saved and cycle length, which are rarely confidential and are easy for a hiring manager to picture.
- Use adoption as the outcome when the financial result is sealed: users retained on the dashboard at 90 days, or requests removed from the queue.
- Never round a proxy in your favour. Anyone in your industry will sanity-check it and the interview will go there first.
Experience bullet under a confidentiality constraint
Weak
Worked on a large-scale profitability analysis project for a leading Indian private sector bank, delivering significant cost savings for the client.
Strong
Built a branch profitability model covering 780 branches for a private bank, which informed the closure or merger of 46 of them.
Nothing confidential was disclosed, but branch count and decision count give the reader everything they need to judge the size of the work.
Getting through the ATS, and what gets resumes rejected
Applicant tracking systems do two things that matter to you: they parse your document into fields, and they match the text against the requisition. Parsing fails on layout, matching fails on vocabulary. Fix both cheaply. For parsing, use a single column for body text, standard section headings that say Experience, Education, Skills and Projects rather than clever alternatives, real text instead of images, no content inside headers or footers, and a PDF exported from a text document rather than a scan. For matching, mirror the job description's own words where they are honestly true of you. If the posting says data visualization, do not rely on the ATS to connect your Tableau line to it. If it says business intelligence, use that phrase somewhere. If it says stakeholder management, and you ran a monthly review for six stakeholders, the phrase belongs in that bullet. This is not keyword stuffing, which is a block of terms in white text or a skills wall of thirty items, both of which a human screener notices and holds against you. It is making sure the words you have earned appear in the form the system is looking for. Two role-specific traps. Analysts often write only the tool name and never the category, so a search for business intelligence misses a resume full of Power BI. And analysts often abbreviate: write both the expansion and the acronym once, such as Power BI Data Analyst Associate (PL-300), so either search finds you. The mistakes below are the ones that survive the ATS and get rejected by the human on the other side, which is the harder filter of the two.
- A skills wall of 30 tools, several of them opened once during a course. Every entry is an interview question you have agreed to answer.
- Dashboards counted instead of decisions changed. Eleven dashboards mean nothing if none of them is still open on a Monday morning.
- No sense of data volume or business scale anywhere on the page, so the reader cannot calibrate the work at all.
- Excel listed as a headline skill with nothing behind it. Say what you do in it, whether that is Power Query, pivot models or scenario analysis, or leave it in the tools line.
- Certifications stacked above work experience. A PL-300 supports your record, it does not substitute for it.
- A photo, date of birth, marital status or father's name. Analytics recruiters in India do not ask for any of it, and it costs you the space a project needs.
- Multi-column layouts, embedded charts and screenshots of dashboards, which older applicant tracking systems read out of order or skip entirely.
- Self-assessed proficiency ratings, star bars and percentage skill meters. They parse as nothing and they invite the interviewer to start at your weakest claim.
- The same resume sent to data analyst, business analyst and data scientist postings. Each one loses to a candidate whose page was written for that job.
| What the job description says | What belongs on your resume | Why |
|---|---|---|
| Data visualization | The phrase itself, plus Power BI or Tableau in a bullet | Tool names alone do not always match a category search |
| Business intelligence | "Business intelligence" in the skills block or a bullet | Common requisition term that analyst resumes routinely omit |
| Statistical analysis | The named technique: hypothesis testing, regression, significance testing | Specific techniques match the phrase and prove it at the same time |
| ETL or data pipeline | The pipeline you built or rebuilt, with the refresh time | Shows the phrase is earned rather than pasted in |
| Stakeholder management | The number of stakeholders and the forum you ran | Turns a soft skill claim into a verifiable fact |
| SQL and Python | Both spelled exactly, plus one depth bullet each | Everyone lists them, so the bullet is what separates you |
Skills to put on a data analyst resume
Technical
- SQL
- Window functions
- Query optimisation
- Python
- R
- Statistics
- Hypothesis testing
- A/B testing
- Experiment design
- Regression analysis
- Cohort analysis
- Funnel analysis
- Forecasting
- Data modelling
- ETL
- Data cleaning
- Data quality checks
Tools and platforms
- Advanced Excel
- Power Query
- Power BI
- DAX
- Tableau
- Looker
- Metabase
- dbt
- Snowflake
- BigQuery
- PostgreSQL
- Google Analytics 4
- Airflow
- Jupyter
- Git
Working skills
- Stakeholder communication
- Requirement gathering
- Data storytelling
- Business acumen
- Presenting to leadership
- Cross-functional collaboration
- Prioritisation
- Written analysis
- Mentoring
Certifications worth listing as a data analyst
| Certification | Full name | Worth it for |
|---|---|---|
| Google Data Analytics | Google Data Analytics Professional Certificate | Worth it for freshers and career switchers who need a structured path through SQL, spreadsheets and visualisation, and something credible to put on a page with no work history. It is widely recognised by recruiters as a starting signal and almost never as a differentiator, so treat it as the floor. If you already have an analyst job, it adds nothing your experience does not already say, and the same weeks spent on two finished portfolio analyses would do more. |
| PL-300 | Microsoft Certified: Power BI Data Analyst Associate | The most useful single certification for analysts in India, because Power BI dominates enterprise BI here and the exam actually tests data modelling and DAX rather than clicking through visuals. Worth it if you are targeting corporate, BFSI, manufacturing or capability centre roles, or if your current work is Tableau-heavy and you want to widen the postings you qualify for. Less useful if you are aiming at product analytics teams that run on SQL and a lightweight BI layer. |
| Tableau Desktop Specialist | Tableau Desktop Specialist | A reasonable entry certification if the roles you want name Tableau explicitly, common in consulting, retail analytics and some global capability centres. It is an easier exam than PL-300 and reads that way, so it supports a fresher resume and adds little to an experienced one. If you can only do one BI certification and you do not know which tool your target employer uses, PL-300 covers more of the Indian market. |
| DP-900 | Microsoft Certified: Azure Data Fundamentals | A short, cheap fundamentals exam that helps when you are moving from pure reporting into a cloud data stack, or when the postings you want mention Azure, Synapse or Fabric. It signals vocabulary rather than skill, so it works best stacked under PL-300 rather than on its own. Skip it if your work already involves a cloud warehouse daily, because the experience bullet outranks the badge. |
| AWS Data Engineer Associate | AWS Certified Data Engineer, Associate | For analysts who genuinely want to move toward analytics engineering or data engineering, and whose target companies run on AWS. It is a real exam with real preparation cost, so only take it if the direction is deliberate. If you want to stay an analyst, it is an expensive way to make your resume look like someone else's, and hiring managers may read it as a candidate who will leave for a data engineering role within a year. |
| Google Cloud Professional Data Engineer | Google Cloud Professional Data Engineer | Worth considering at senior or lead level where you influence platform choices and your organisation runs on BigQuery. It carries weight in interviews about architecture and cost, not in interviews about analysis. For a mid-level analyst who spends the day in SQL and Power BI, this is the wrong certification to spend three months on, and a written case study of an analysis you led would move a hiring decision further. |
| dbt Analytics Engineering | dbt Analytics Engineering Certification | Useful for analysts at companies with a modern warehouse stack, and a strong signal for the analytics engineer job titles that increasingly sit between analyst and data engineer. It is only credible alongside real dbt work, since the exam assumes hands-on modelling habits. If you have never run a dbt project, build one on a warehouse free tier first, because the project will get you further in the interview than the certificate will. |
Keywords an ATS scans for in a data analyst resume
These are the literal terms a parser matches against the job description. Use the ones that are true of you, in the sentences where you did the work, not as a list at the bottom.
- data analyst
- SQL
- Python
- data visualization
- dashboard development
- business intelligence
- A/B testing
- statistical analysis
- ETL
- data pipeline
- Power BI
- Tableau
- Excel
- data modelling
- KPI reporting
- cohort analysis
- forecasting
- stakeholder management
- data quality
- requirement gathering
Data Analyst resume FAQ
How long should a data analyst resume be?
One page up to roughly six years of experience, two pages after that and only if the second page earns its place. A lead running a team with three or four roles behind them will need the space. An analyst three years in almost never does, and a padded second page reads worse than a tight first one. If you are struggling to fit, cut projects before you cut experience, and compress roles older than five years to two or three bullets each.
What goes on a data analyst resume with no experience?
Projects, placed above education and above skills. Each one should state the question you answered, the data and its scale, the method you chose and the decision it would change. Three finished analyses with a clear conclusion beat ten notebooks with charts in them. Add an internship if you have one, even a short one, with numbers attached to whatever you actually changed. Certifications go after skills, and a statistics, economics or mathematics degree stays visible near the top.
Should I list every tool I have touched?
No. Twelve to fifteen skills, grouped into languages, BI tools and methods, covers almost every job description honestly. Anything on the page is fair game in the interview, so a tool you used once in a tutorial is a liability rather than a keyword win. Drop the self-assessed proficiency ratings and star bars too. They parse as nothing for an applicant tracking system and they invite an interviewer to open at whatever you rated lowest.
How do I quantify my work if the numbers are confidential?
Change the unit instead of dropping the number. Use percentage change, a ratio, hours saved, cycle time, or the size of what you served such as branches, markets, row counts or users of the dashboard. Describe a client by sector and scale rather than by name, for example a private bank with 780 branches. If even relative figures are restricted, use adoption and effort instead: stakeholders on the review, reporting hours removed, days cut from a close cycle.
Is a data analyst resume different from a business analyst resume?
Yes, and hiring managers notice when the two are confused. A data analyst resume leads with querying, statistics, experimentation and the metric that moved. A business analyst resume leads with requirements, process mapping, stakeholders and the change that shipped. The overlap is real but the emphasis is not. If you are applying to both, keep two versions rather than one that hedges, because a hedged resume loses both comparisons to someone who wrote for that specific job.
Do certifications actually help a data analyst get hired in India?
They help most when you have the least to show. For a fresher or a switcher, a PL-300 or the Google Data Analytics certificate gives a recruiter something to hold on to. For an analyst with three or more years, experience outranks certificates every time, and a page that stacks five badges above thin work history reads as compensation. Pick one certification that matches the stack your target employers actually run, and spend the rest of the time on a portfolio piece.
Should I include a career objective on a data analyst resume?
Only if you are a fresher or changing domains, and then only as one clause inside the summary rather than a separate section. A generic objective about seeking a challenging role in a reputed organisation is space you are giving away. A switcher's version earns its place because it answers a question the reader is already forming: four years in supply chain operations, now analysing the same problems in SQL, targeting a supply chain analytics role.
How many bullets should each role get?
Five or six for your current role, four or five for the one before it, and three for anything older. The taper matters as much as the count, because a resume where a role from six years ago is as detailed as the current one suggests your best work is behind you. Keep each bullet to one idea and roughly two lines. A four line bullet with three achievements buried in it gets read as one achievement, and the other two are wasted.
Should I put machine learning on a data analyst resume?
One line, if it is real. A single modelling bullet with an honest metric and a business outcome signals range and reassures a hiring manager that you can go further than descriptive work. Four modelling bullets turn an analyst resume into a weak data scientist resume, which then competes against candidates who do that full time. If the role you want is genuinely a data science role, write a different resume rather than stretching this one to cover both.
Does a data analyst resume need a portfolio or GitHub link?
It helps for freshers and switchers and is optional after that, but only link something you would be happy to have opened during the interview. A repository with three finished analyses, each carrying a written conclusion, is an asset. A repository with eleven half-run notebooks and no README is worse than no link at all. If you do include it, put it in the header line next to your city, not in a separate section at the bottom.
Related resume examples and guides
Build your own in any of these formats
Start from a blank resume or upload the one you already have. The builder renders it in 24 templates and flags the results an applicant tracking system will not be able to find.
Build my resume